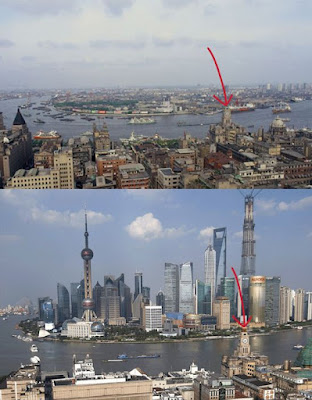
The Pando (pictured here) appears to be 107 acres of forest, but scientists have concluded that the nearly 47,000 genetically identical quaking aspen trees share a common root system. It is a single organism. It is estimated to be around 80,000 years old and weighs something of the magnitude of 13 million pounds. It may be dying. Many market participants also struggle to distinguish the forest from the trees. It is not a personal failing; it is systemic. The immediacy of the market for many participants demands full attention. Correlations are unstable, and although most of our analytic tools require normal distribution, the returns in the market are anything but. The old model of the market as a place where profit-seeking economic agents clash has to be
Topics:
Marc Chandler considers the following as important: 4.) Marc to Market, 4) FX Trends, China, Featured, inflation, newsletter, stagflation, U.K., US
This could be interesting, too:
Nachrichten Ticker - www.finanzen.ch writes Die Performance der Kryptowährungen in KW 9: Das hat sich bei Bitcoin, Ether & Co. getan
Nachrichten Ticker - www.finanzen.ch writes Wer verbirgt sich hinter der Ethereum-Technologie?
Martin Hartmann writes Eine Analyse nach den Lehren von Milton Friedman
Marc Chandler writes March 2025 Monthly
The Pando (pictured here) appears to be 107 acres of forest, but scientists have concluded that the nearly 47,000 genetically identical quaking aspen trees share a common root system. It is a single organism. It is estimated to be around 80,000 years old and weighs something of the magnitude of 13 million pounds. It may be dying.
Many market participants also struggle to distinguish the forest from the trees. It is not a personal failing; it is systemic. The immediacy of the market for many participants demands full attention. Correlations are unstable, and although most of our analytic tools require normal distribution, the returns in the market are anything but. The old model of the market as a place where profit-seeking economic agents clash has to be re-imagined. Many participants are not trying to maximize profits but to lock in certainty. Some hedgers pay to fix prices, and others are willing to assume the risk with compensation.
While focusing on the immediate trees, the market seems to bounce around from one view of the forest to another. The secular stagnation hypothesis was arguably dying a death by 1000 blows before the pandemic struck. And when it did strike, it seemed like the end of days, and disruptions cascaded to even unhinge the US Treasuries, the critical ganglia of the capital markets. The announcement that a vaccine was discovered fanned the reflation trades, but something strange took place. After more than doubling to almost 1.80% at the end of Q1, the US 10-year yield trended sharply lower and put in a double bottom below 1.15% in July and August. Over the last couple of months, the yield has trended higher. It approached 1.60% before the September jobs report.
The forest du jour is "stagflation," which connotes a weak economy and strong price pressures. It harkens back to the mid-1970s-early 1980s. Unemployment reached 9% in May 1975. It fell back briefly below 5.5% as the US emerged from recession, but then rose to nearly 11% as Reagan and Volcker tried to wring out inflation in a one-two punch of breaking organized labor and sado-monetarist policies.
Consumer prices rose around 1% in the first half of the 1960s and trended above 5% by the end of the decade. Then, pressures eased, and CPI slowed 3% in the summer of 1972, before surging to nearly 12.5% by the end of 1974. Two years later it was below 5% and then trended higher to climax in March 1980 a little shy of 15%.
This was particularly vexing because it was thought to be impossible to have both high unemployment and high inflation at the same time. A soft labor market should contain prices through the demand and income channels. Arguably, the Phillips Curve, first articulated in the late 1950s, suffered a mortal blow then, though it is still being debated more than 60 years later. Any fuzzy shorthand phrase to encapsulate the conflicting forces and unprecedented pandemic experience will falter upon anything more than a superficial examination. It is mainly the case with stagflation.
The most important point is that it is hard to consider, say around 6% growth in the US this year as stagnant no matter how much one stretches the meaning. The median Fed forecast for 2022 growth is a little more than 3.5%, which would put it at the second strongest year (after 2021) since 2004. Unemployment is not a good fit either for the stagflation forest. Since peaking at the start of the pandemic (14.8% in April 2020), it has fallen faster than officials and private-sector economists expected. In September, it stood at 5.1%, but standing is the wrong image. It is falling. With a more forceful use of the stick to provide more incentives to be vaccinated, and the recent increase in cases subsiding, further improvement in the labor market should be expected. The issue seems more about the pace than the direction.
Some pundits see stagflation in the UK. Yet here, too, the label is more concealing than revealing. The UK economy is on pace for something around 6% this year and is projected to grow above 5% next year. Both projections may err on the side of optimism, but even so, growth is unlikely to stagnate. The Bank of England forecasts inflation to reach 4% this year and decelerate to 2.5% next year and 2.0% in 2023. The market seems to be less confident. The 10-year breakeven (the difference between the convention and inflation-linked yields) has risen by about 50 bp since the end of June to approach 4%. In contrast, the US 10-year breakeven stands near 2.48%, up around 15 basis points so far in H2.
Next week, the world's two largest economies report September consumer and producer prices. China will report its figures several hours after the US report is released on October 13. After surging earlier this year, US consumer prices have stabilized in recent months. Recall that after beginning the year at a 1.4% year-over-year pace, the headline inflation pace tripled to 4.2% by early Q2 and then quickened to 5.4% in June. It likely remained in the 5.3-5.4% Q3 three-month range in September.
Prices are expected to have risen by 0.3% in September. If true, then the annualized pace so far this year will slow to about 6.2% from 6.6% in August and 7.2% at the end of H1. The annualized pace in Q3 would be 4.4%. The core rate, which excludes food and energy, is important, but not because the Fed targets it, which it does not do. The target applies to the headline deflator of personal consumption expenditures. It makes little sense to call the core rate the Fed's preferred rate when it does not target it.
Still, the core rate is important because historically, the headline rate has converged to it rather than the other way around. Through August, the core rate has risen at an annualized pace of almost 5% this year. It is forecast to have increased by 0.2% in September, which would leave the year-over-year unchanged at 4.0%. Recall that the core rate peaked in June at 4.5% before easing. If last month's core prices rose as expected, the annualized rate would moderate to below 4.7%. Another way to capture the underlying pace, consider that the annualized core pace was over 10% in Q2. A 0.2% increase in September would put annualized rate near 2.5% in Q3.
While recognizing that price pressures remain elevated by more than anticipated, most Fed officials continue to argue that they are transitory in nature. The increases are a function of the base effect (e.g., around 18 months ago, the price of crude oil was negative), the uneven recovery, and supply chain disruptions. Whether the inflation overshoot is transitory or not requires perspective, like seeing the forest, not just trees. It has not been proven wrong.
The pressures are understood to be coming primarily from supply constraints. Although faith in self-regulation has waned (see Global Financial Crisis), confidence remains that businesses, seeing opportunity, will quickly respond to incentives to overcome supply constraints. The stronger-than-expected magnitude that prices have risen says little about duration. Moreover, the steep rise in energy prices is not understood by policymakers as inflationary but, on the contrary, almost like a consumption tax. It is ultimately deflationary.
In contrast to most countries, China is not experiencing strong upward pressure on consumer prices. In August, consumer prices were 0.8% higher than a year ago. Consider that just in the month of June, US consumer prices rose by 0.9%. There are two critical forces at work. First, food prices in general, particularly pork prices, have fallen (4.1% year-over-year). Second, non-food prices have risen modestly. Recall that in January and February, they were still lower than in at the start of 2020. In August, non-food prices rose 1.9% year-over-year. Also, it appears that weak demand may be contributing to subdued consumer inflation.
Without an inflation constraint, and given the knock-on effect of the disruption caused by Beijing's actions and the collapse of Evergrande, the PBOC is widely expected to reduce reserve requirements. The energy shortage and purposeful cuts in output to meet emission targets also point to slower growth. While sustaining high levels of growth will not solve Beijing's challenges, it will make them easier to address.
Tags: China,Featured,inflation,newsletter,stagflation,U.K.,US


