If last month’s payroll report was declared to be strong at +128k, then what would that make this month’s +266k? Epic? Heroic? The superlatives are flying around today, as you should expect. This Payroll Friday actually fits the times. It wasn’t great, they never really are nowadays (when you adjust for population and participation), but it was a good one nonetheless. November 2019, according to the BLS, was the first month since January to register better than +220k in payroll gains. That had been a conspicuously long stretch, long enough that it had been unmatched since the dicey days of QE3 in 2012. If there were recession fears in the Establishment Survey, it wasn’t any single monthly estimate it was the consistency in that regard. Gains over the past two
Topics:
Jeffrey P. Snider considers the following as important: 5.) Alhambra Investments, Average Hourly Earnings, average weekly earnings, currencies, economy, establishment survey, Featured, Federal Reserve/Monetary Policy, hours, household survey, job gains, jobs, Labor market, Markets, newsletter, payrolls, total hours worked, unemployment rate, wages
This could be interesting, too:
Nachrichten Ticker - www.finanzen.ch writes Die Performance der Kryptowährungen in KW 9: Das hat sich bei Bitcoin, Ether & Co. getan
Nachrichten Ticker - www.finanzen.ch writes Wer verbirgt sich hinter der Ethereum-Technologie?
Martin Hartmann writes Eine Analyse nach den Lehren von Milton Friedman
Marc Chandler writes March 2025 Monthly
|
If last month’s payroll report was declared to be strong at +128k, then what would that make this month’s +266k? Epic? Heroic? The superlatives are flying around today, as you should expect. This Payroll Friday actually fits the times. It wasn’t great, they never really are nowadays (when you adjust for population and participation), but it was a good one nonetheless. November 2019, according to the BLS, was the first month since January to register better than +220k in payroll gains. That had been a conspicuously long stretch, long enough that it had been unmatched since the dicey days of QE3 in 2012. If there were recession fears in the Establishment Survey, it wasn’t any single monthly estimate it was the consistency in that regard. Gains over the past two months were revised higher, bringing the more important 6-month average up to nearly +200k for the first time since April. |
Establishment Survey; Blowout Payrolls, 2014-2019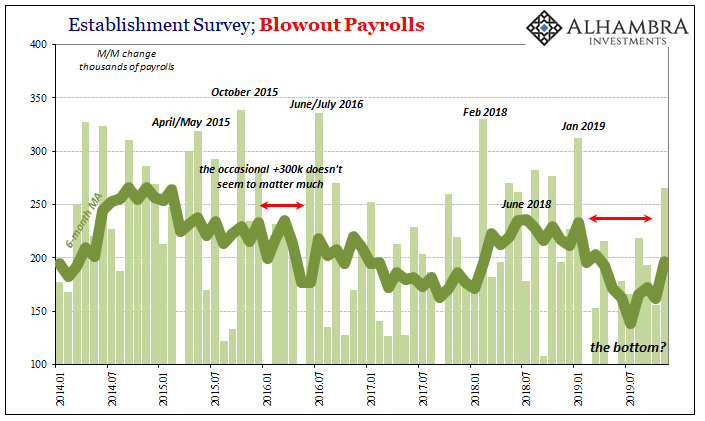 - Click to enlarge |
| For many, it will be taken as a further sign of “the bottom”, the passing of a strong economy through and out of those “transitory” cross currents (they couldn’t even bring themselves to call them “headwinds” as had been past tradition for fear of what that might say to the public) on its way back to acceleration and inflationary expansion. What were those cross currents, exactly? No one knows for sure but now fewer care.
The Household Survey was less celebratory, growing minimally as did the size of the labor force. As is usual with these data points, they are noisy month to month. One payroll report no matter how decent (Establishment Survey) or not decent (Household Survey) shouldn’t change anyone’s mind. As always, the averages. |
Average Weekly Hours All Employees, 2007-2019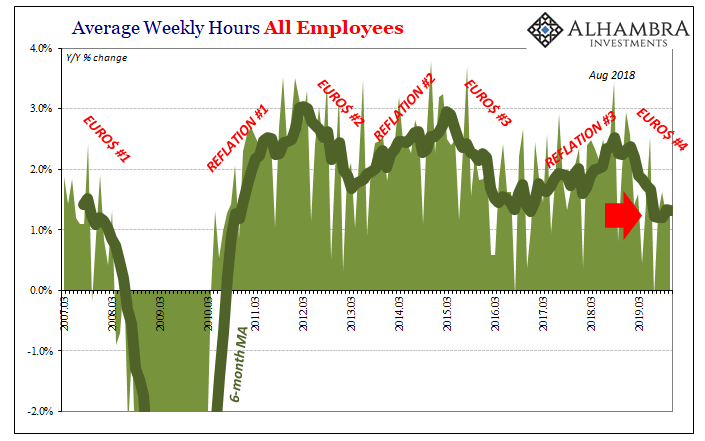 - Click to enlarge |
| The V-shape for the payroll average on the chart above does seem consistent with the idea of a bottom.
There are other possibilities. As noted last month, the labor market may go in stages. Starting in late 2006, it downshifted through early 2007 before rebounding somewhat late in the year. Employment then downshifted again into what became the Great Recession. If anything in the details is to spoil the November payroll party it has to be hours. While the highly-smoothed Establishment Survey shows us that potential “V”, the more granular index of total hours worked displays instead the stubborn downshift. Not just a possible lower level of labor utilization, one that remains at the lowest rate of the last decade. Persistent, stubborn weakness here is a major concern. |
Full Employment slack, 1983-2019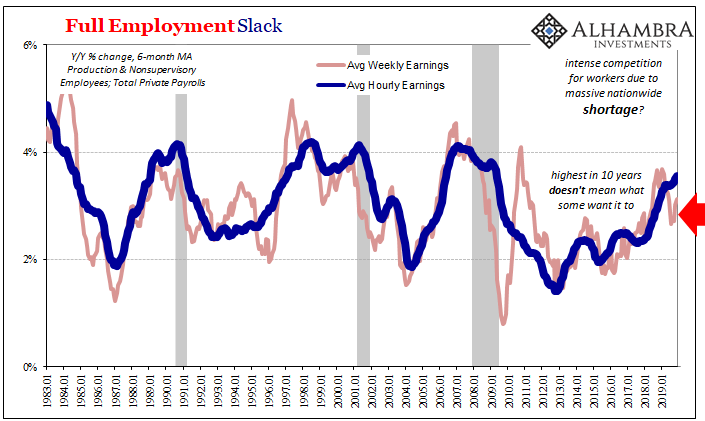 - Click to enlarge |
| That is why average weekly earnings growth has decelerated, as average hourly earnings rates topped out. Companies no longer in much rush for new work (as they were never in one even during the climax of 2017’s labor story inflation hysteria) aren’t assertively bidding up the price of their workforce. Combined with lower growth in hours, that’s less expansion in average weekly earnings.
A little less, therefore not yet any kind of serious issue; still noticeable, though, meaning another small piece of evidence for the downshift instead of the “V.” |
Labor Market Growth Rates by Calendar Year, 1968-2019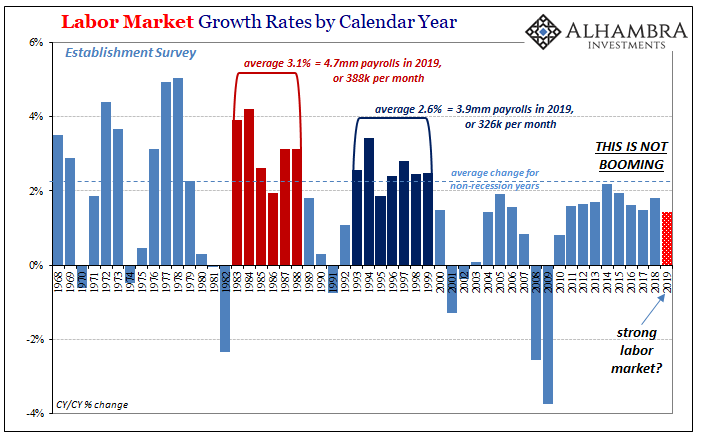 - Click to enlarge |
| Even with the pickup in the Establishment Survey the past few months, looking at the labor trends more long-term 2019 remains on pace to be the weakest one since 2010 – lesser than 2017 as well as 2011. In order for this year’s employment condition to reach or surpass either of those will require December to duplicate November’s good estimate. Perceptions like these do matter.
If that happens, then it will strengthen the case for the “V.” If instead November proves to be the noisy outlier on the upside, then the payroll stats are easily back toward more on the side of the downshift. |
Labor Market Growth Rates by Calendar Year, 2003-2019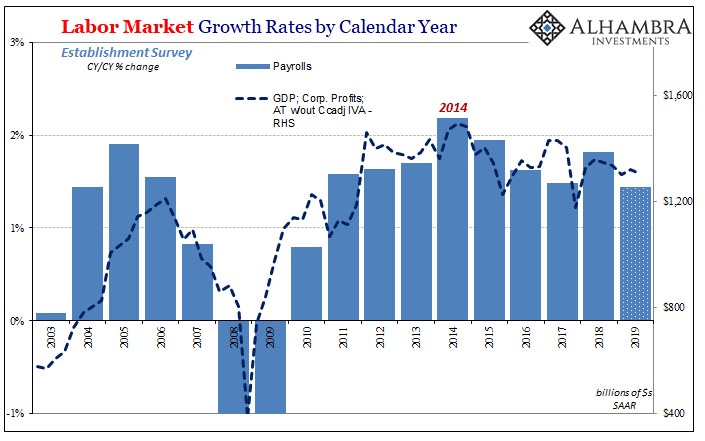 - Click to enlarge |
Either way, there is still no recession in any of these numbers. For some, the fact that it is now November (for labor estimates) and one hasn’t materialized (or even come all that close) is a comforting result; if it was going to happen, it would’ve by now.
The downshift possibility, though, is quite the opposite. The more time in a lesser position, the more likely weakness triggers a bigger downside (again, perceptions). Since the labor market is a lagging factor, and given how in other accounts more recently the US economy is just now starting to accelerate toward that potential downside, (surprising no one) I’m less convinced by the “V.” Others will gravitate toward the opposite interpretation.
I had to chuckle at a comment made by my colleague Joe Calhoun today in light of these numbers; he noted how despite their emphatically positive reception the 10-year UST bond yield is up less than 6 bps today compared to last Friday, and is “somehow” just a tiny hair lower than when last month’s “awesomely awful” jobs report came out.
And that’s the thing about the payroll reports. Despite the constant attention and overhyped focus on them, they really, really don’t mean all that much by themselves. They are perfectly disposable figures. The public demands (trust me) we focus on them regardless, even as they are discarded and forgotten sometimes just that quickly.
Tags: average hourly earnings,average weekly earnings,currencies,economy,establishment survey,Featured,Federal Reserve/Monetary Policy,hours,household survey,job gains,jobs,Labor Market,Markets,newsletter,payrolls,total hours worked,unemployment rate,wages