There has been a lot of talk about the economic impact of the recent tax reform. All of it, including the analyses that include lots of fancy math, amounts to nothing more than speculation, usually informed by little more than the political bias of the analyst. I am guilty of that too to some degree but I don’t let my personal political views dictate how I view the economy for purposes of investing. I am, to put it mildly, a skeptic. I don’t believe half of what I hear from politicians or economists – sadly not that much different these days – and even less of what I hear from Wall Street. I rely on the markets – the wisdom of crowds – to understand the economy. While almost everyone on Wall Street and Main Street
Topics:
Joseph Y. Calhoun considers the following as important: Alhambra Research, Bi-Weekly Economic Review, bonds, cfnai, commodities, credit spreads, currencies, durable goods orders, economic growth, economy, employment, Featured, Gold, inflation, Interest rates, Inventories, Market Sentiment, Markets, newslettersent, Politics, stocks, Taxes/Fiscal Policy, The United States, trade, US dollar, Yield Curve
This could be interesting, too:
Investec writes The Swiss houses that must be demolished
Claudio Grass writes The Case Against Fordism
Nachrichten Ticker - www.finanzen.ch writes Die Performance der Kryptowährungen in KW 9: Das hat sich bei Bitcoin, Ether & Co. getan
Nachrichten Ticker - www.finanzen.ch writes Wer verbirgt sich hinter der Ethereum-Technologie?
There has been a lot of talk about the economic impact of the recent tax reform. All of it, including the analyses that include lots of fancy math, amounts to nothing more than speculation, usually informed by little more than the political bias of the analyst. I am guilty of that too to some degree but I don’t let my personal political views dictate how I view the economy for purposes of investing. I am, to put it mildly, a skeptic. I don’t believe half of what I hear from politicians or economists – sadly not that much different these days – and even less of what I hear from Wall Street.
I rely on the markets – the wisdom of crowds – to understand the economy. While almost everyone on Wall Street and Main Street are trying to read the economy in the hope they can predict the future of the markets, I concentrate on trying to figure out what the markets are saying about the present economy. I eschew the impossible for the merely difficult. When people ask me about our outlook I’m often at a loss for words because we really don’t have one. We take things as they come and adjust as necessary. Contrary to popular belief, it is not necessary to predict the future accurately – an impossible task – to be a good investor. But you do need to see the present clearly. And our internal biases – political and other – make that difficult but not impossible.
In these twice monthly reports, I do review the recently released economic data but mostly to confirm what we see in our market based indicators. If there are divergences we will generally rely on the market data rather than the oft revised individual releases of economic data. What do I see today? Believe it or not, there has been little change in the market’s view of the economy. Right handed economists claim tax reform will accelerate growth now while the left handed ones say the opposite. The market is unbiased – ambidextrous one might say – and its verdict is that neither is right. So far, all we’ve seen is an upturn that has taken us to the high end of the range we’ve been in since mid-2013. Tax reform may indeed eventually push us out of that new normal rut we’ve been in but it hasn’t yet.
Economic Reports
Economic Growth & Investment
While a lot of the incoming economic data is just so much noise, when you add it all up you can get some useful information. One indicator that does that is the Chicago Fed National Activity Index. It is a weighted average of 85 existing monthly indicators of national economic activity. A value of zero means the economy is growing at trend while a positive value indicates growth above trend and a negative value the opposite. The January read was 0.12, down slightly from a December read of 0.14. December was originally reported as 0.27 but was revised lower. If you aggregate a bunch of individual data points that are subject to revision then the aggregation too will be subject to revision. That’s why you can’t take this for gospel and use it as a standalone indicator. What I find interesting about the CFNAI right now is that at 0.12 it says the economy is growing just slightly above trend. In other words it isn’t confirming the narrative of the economic bulls – or the bears.
Coincidentally, we also received the second estimate of Q4 GDP during the last fortnight and it confirms what the CFNAI says. GDP growth was downgraded by one tenth to 2.5%. That is, as I said above, the high end of the range that has persisted since 2013. In other words, ho hum. That isn’t to say that tax reform isn’t having an impact. Personal income rose a better than expected 0.4% on the month which can largely be attributed to reduced taxes. Likewise disposable personal income up 0.9%. But because personal spending was up only 0.2% it seems a large portion of the tax cut merely raised the saving rate to 3.2% from last month’s 2.5%. And while personal income is rising, an annual rate of less than 4% isn’t all that great compared to previous expansions.
Economic growth is a function of work force growth and productivity. While we did see an increase in workforce participation last month (more on that down below) productivity remains a big, big problem for this economy. Q4 productivity was revised up all the way from -0.1% to 0.0% and that just isn’t going to do much for growth. Productivity is a function of investment and that is what a lot of the corporate tax changes were about but even if it works as advertised it won’t happen overnight.
Production
The production surveys – ISM manufacturing and non-manufacturing, Chicago PMI, Dallas and Richmond Fed surveys – were all positive although the Chicago report was slightly less than expected. These sentiment surveys, like their consumer counterparts, have been very positive but the optimism has yet to spill over to the actual hard data.
Consumption & Distribution
Consumer spending, as noted above, was up in January but it was not a robust reading. Durable goods spending was down and while non-durables were up, much of that was due to higher gas prices. Sales at the wholesale level were down in January by 1.1% as the surge in auto sales after Hurricane Harvey appears to have been exhausted.
Inventories
Wholesale inventories rose 0.8% in January, probably not by design. Sales, as noted above, were down and the inventory/sales ratio rose from 1.22 to 1.26. That reverses all of the improvement in that ratio dating back to the hurricanes. It seems that much of the increased activity of the last 5 months was driven by hurricane recovery efforts. That is consistent with our research of past storms that showed increased activity for 4 to 6 months after the storm depending on severity. If you haven’t been keeping count, March is month six since Irma.
Orders
The upturn in orders that accompanied the hurricane induced surge appears to have peaked too. Factory orders were down 1.4% in January confirming the earlier durable goods report which showed a steeper fall of 3.7%. Durables ex-transportation were down 0.3% and core capital goods orders were down 0.2%. All of these were less than expected. Orders are near the highs for the cycle but still less than the peak of the last cycle nearly a decade ago. Core capital goods orders show an even worse trend, still less than the peak at the turn of the century.
Trade
Trade didn’t offer any more comfort. Exports were down 1.3% while imports were flat. Just looking at goods, exports were down nearly double that amount and imports were lower too. For exports the culprit was capital goods while the drop in imported goods was concentrated in consumer goods.
Inflation
About the only place you find inflation is in housing prices. The FHFA price index showed a 0.3% gain for December while Case Shiller showed twice that mount. Both are up over 6% year over year.
The PCE price index was up 1.7% and 1.5% at the core level. Both of those are well south of the Fed’s target.
Employment
The big news in last month’s employment report was the hotter than expected wage component but those fears were eased with the latest report. Both the ADP and official versions of the employment report were quite a bit better than expected. The official version showed a gain of 313,000 with average hourly earnings back to punk at +0.1%. It seems too that some people were brought back to the workforce as the participation rate rose from 62.7% to 63%. The workweek also ticked a bit higher at 34.5 hours. Overall, it was just about a perfect report. I do wonder what revisions will do to this report long after it is forgotten because some of the report seemed a bit strange. Retail, for instance, supposedly added 50,000 jobs when all it has been doing for months is shedding them. Did retailers suddenly decide they had cut too much? Construction too was quite robust, adding 61,000 jobs. With private non-residential and multi-family construction both falling that seems an excessive number of new workers for the current pace of single family building.
Construction
Construction spending for January was flat with non-residential spending down 1.1% yoy and multi-family down 2.4% yoy. Single family is the bright spot, up 8.8% yoy.
Unfortunately, new home sales were down for the month and also year over year. Furthermore, median price fell 4.1% and supply rose to over 6 months. Not exactly booming but new home sales are still in an uptrend since the nadir in 2010.
Sentiment
If the tax cut is having an impact right now it is on sentiment. Consumer sentiment rose to 99.7 in the latest report with rising expectations driving the change. Like the production surveys though, this rising consumer sentiment isn’t really showing up in the hard data (see the personal consumption report).
Market Indicators
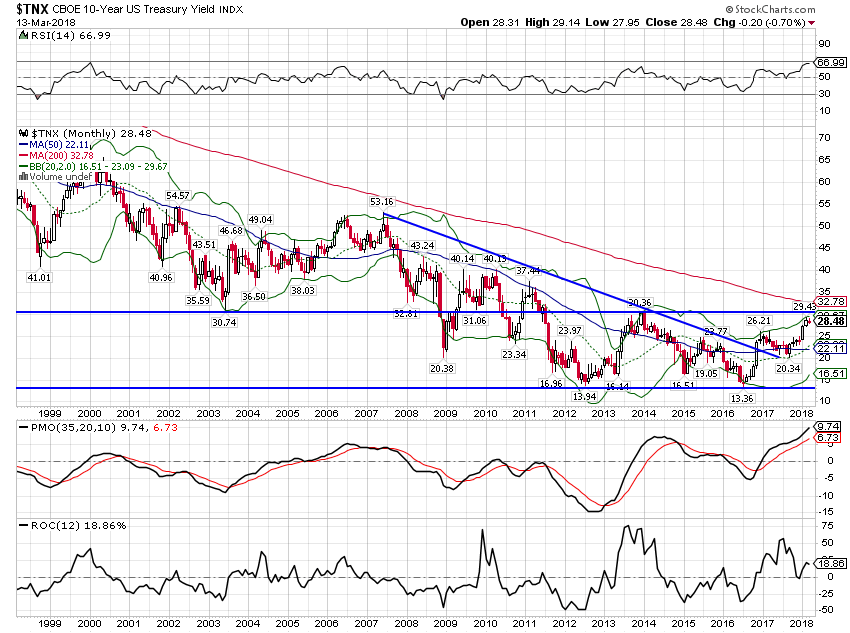
10 Year Treasury Note YieldThe 10 year yield was barely changed since the last update and at 2.85% is down just about 10 basis points since peaking at 2.95% and frustrating the horde of commentators calling for a 3 handle. The yield is, as noted, right near the high since 2013. |
US Treasuries Daily, 1999 - 2018(see more posts on U.S. Treasuries, ) |
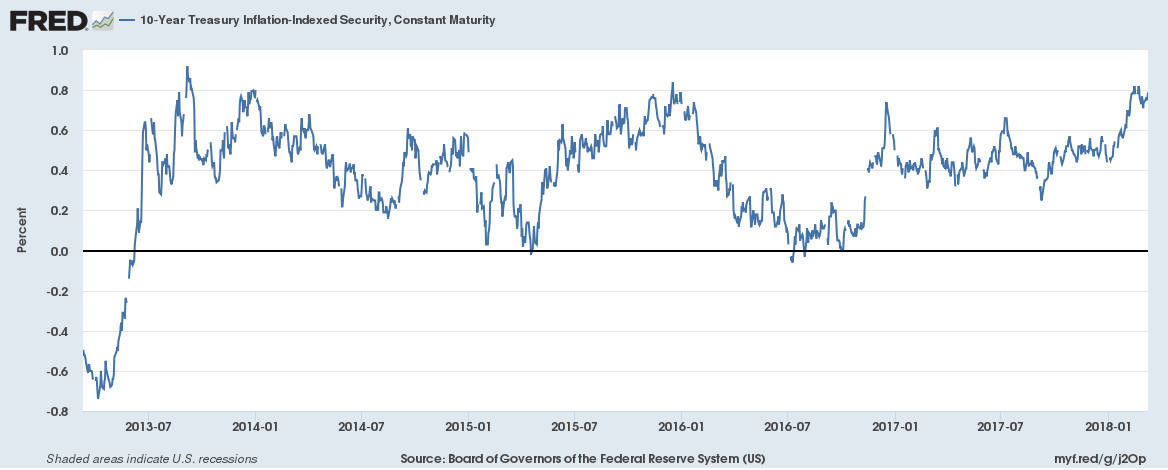
10 Year TIPS YieldLike the nominal 10 year the 10 year TIPS is right near the high of its range. Real growth expectations are near the high but not breaking out to a new higher range. |
10 Year TIPS Yield, Jul 2013 - Jan 2018 |
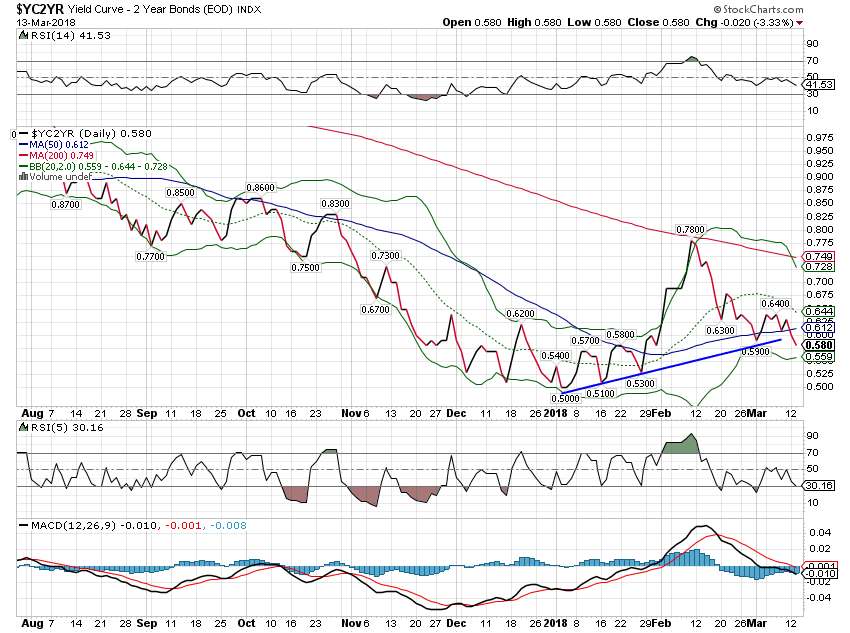
10/2 Yield CurveThe yield curve is back in flattening mode after the short spike in February. We are still a bit above the lows but headed in that direction. The yield curve movement indicates reduced future growth but is not acting as we would expect prior to recession. |
Yield Curve, Aug 2017 - Mar 2018 |
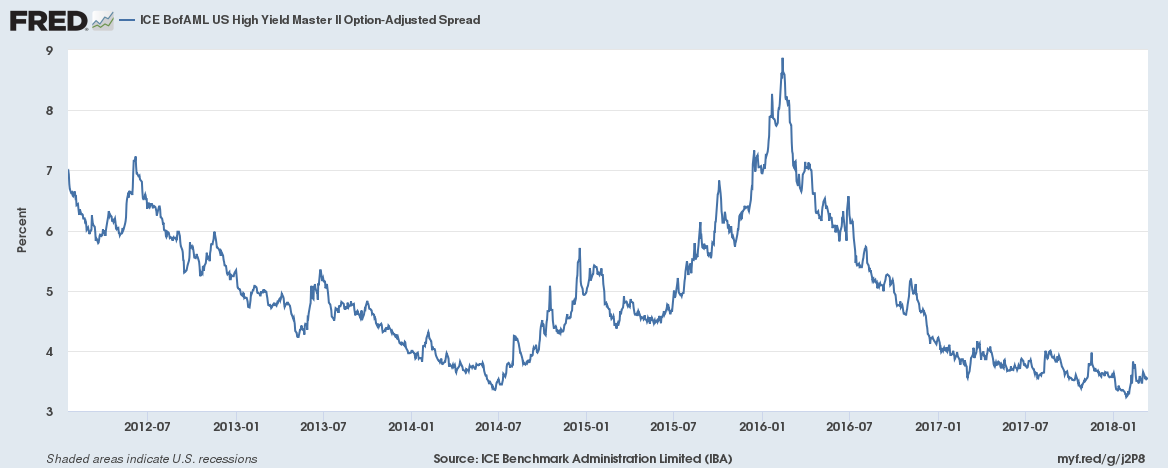
Credit SpreadsSpreads widened slightly over the last two weeks but not enough to raise any warnings. |
US High Yield Master, Jul 2012 - Jan 2018 |
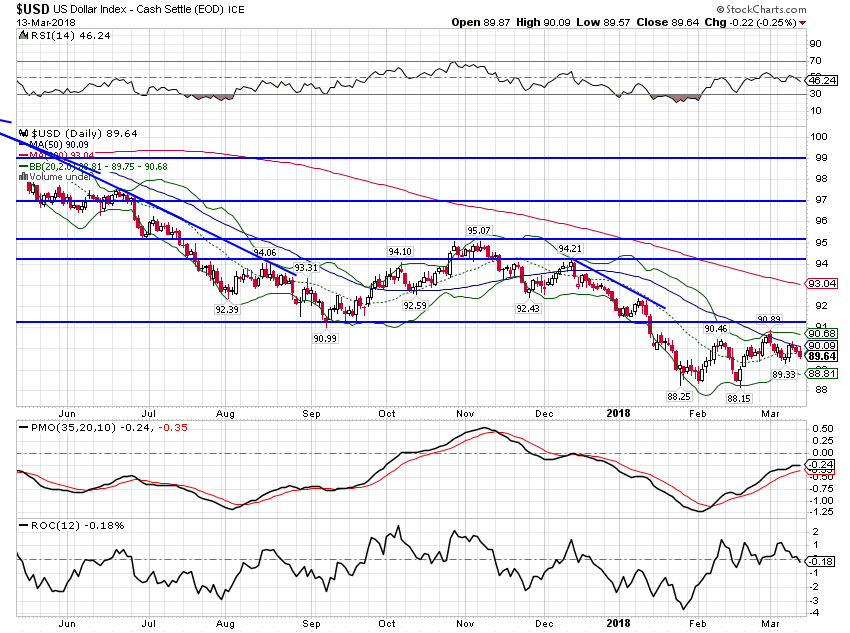
US DollarThe dollar tried to rally but can’t seem to get any momentum to the upside. I still think there might be some kind of rally as long Euro is still a crowded trade but nothing seems to spur dollar buyers. There are probably multiple reasons for that but I keep coming back to the idea that Presidents get the dollar they want and this one wants a weak one. So does his Treasury Secretary. I think they will be mightily disappointed with the results but they seem intent on proving once again that we can’t devalue our way to prosperity. |
US Dollar Index, Jun 2017 - Mar 2018(see more posts on U.S. Dollar Index, ) |
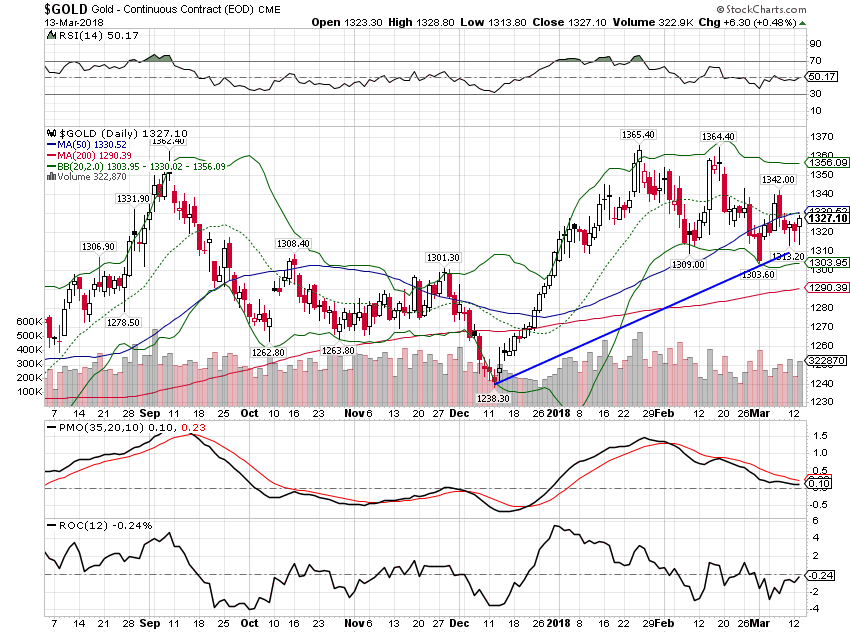
CommoditiesGold is up about $10 since the last update and continues to be supported by the weak dollar. Rising gold is not usually associated with robust economic growth. |
Gold Daily, Sep 2017 - Mar 2018(see more posts on Gold, ) |
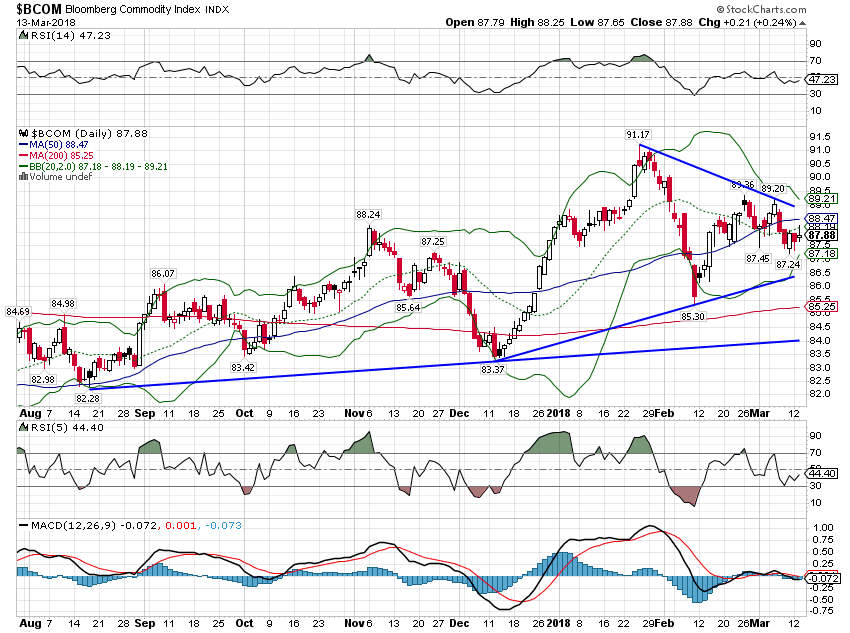
| General commodities were down a little since the last update but are still in an uptrend. |
Bloomberg Commodity Index, Aug 2017 - Mar 2018 |
There is nothing in the economic data or our market indicators that supports the improving growth narrative. The after effects of the hurricanes is now fading and absent a surge from somewhere else I would expect our indicators to confirm a slowing. But absent some shock it will probably be just that – a slowing. The economy is now at the top of that range of growth that has prevailed for the last 5 years and I see nothing to indicate we will move out of it – up or down. The new normal or whatever you want to call it continues.
Tags: Alhambra Research,Bi-Weekly Economic Review,Bonds,cfnai,commodities,credit spreads,currencies,durable goods orders,economic growth,economy,employment,Featured,Gold,inflation,Interest rates,Inventories,Market Sentiment,Markets,newslettersent,Politics,stocks,Taxes/Fiscal Policy,Trade,US dollar,Yield Curve


