As with all statistics, there are discrepancies that from time to time may obscure the meaning or validity of the particular estimate in question. For the vast majority of the time, any such uncertainties amount to very little. Overall, harmony among the major accounts reduces the signal noise from any one featuring a significant inconsistency. There are, of course, various economic areas where estimates are going to be questionable no matter what. For example, though we have what are taken to be solid figures on both sides of the Pacific, there has been a very large disagreement as to how much trade the US and China actually undertake with each other. The Congressional Research Service in March 2016 claimed: From the U.S. perspective, its bilateral trade deficit with China more than quadrupled in value over the last 14 years, from just over billion in 2001 to over 7 billion in 2015. However, from the Chinese view, its bilateral trade surplus with the United States increased nine-fold, from about billion in 2001 to more than 7 billion in 2015. No satisfactory answer has yet been found for such an enormous difference, though there are several candidates proposed.
Topics:
Jeffrey P. Snider considers the following as important: China, China Consumer Price Index, China Exports, China Imports, currencies, depression, Dollar, economy, EuroDollar, exports, Featured, Federal Reserve/Monetary Policy, global trade, imports, Markets, newslettersent, People's Bank Of China, statistical discrepancy, Statistics, trade, Trade Balance
This could be interesting, too:
Nachrichten Ticker - www.finanzen.ch writes Die Performance der Kryptowährungen in KW 9: Das hat sich bei Bitcoin, Ether & Co. getan
Nachrichten Ticker - www.finanzen.ch writes Wer verbirgt sich hinter der Ethereum-Technologie?
Marc Chandler writes March 2025 Monthly
Mark Thornton writes Is Amazon a Union-Busting Leviathan?
As with all statistics, there are discrepancies that from time to time may obscure the meaning or validity of the particular estimate in question. For the vast majority of the time, any such uncertainties amount to very little. Overall, harmony among the major accounts reduces the signal noise from any one featuring a significant inconsistency.
There are, of course, various economic areas where estimates are going to be questionable no matter what. For example, though we have what are taken to be solid figures on both sides of the Pacific, there has been a very large disagreement as to how much trade the US and China actually undertake with each other. The Congressional Research Service in March 2016 claimed:
From the U.S. perspective, its bilateral trade deficit with China more than quadrupled in value over the last 14 years, from just over $83 billion in 2001 to over $367 billion in 2015. However, from the Chinese view, its bilateral trade surplus with the United States increased nine-fold, from about $28 billion in 2001 to more than $237 billion in 2015.
No satisfactory answer has yet been found for such an enormous difference, though there are several candidates proposed. The report submits “under-invoicing”, the twin of Hong Kong “over-invoicing” on China’s import side, as well as “mid-shipment transfers in ownership resulting in the new owner adding a markup in the price.” There are also value differences particularly where goods are shipped through third or fourth party countries and principalities (such as Hong Kong), which also has the effect of obscuring, for both sides, the country of origin/destination.
There has also emerged something of a further discrepancy from within the Chinese statistics. The General Administration of Customs (GAC) tabulates the monthly trade estimates for China, those that you see described every month in the mainstream media reports. According to their latest press release for the month of March 2017, Chinese exports rose 16.4% year-over-year. Though there are calendar and price effects to consider in that amount, China’s other government agencies such as the National Bureau of Statistics and the Ministry of Commerce which supplies the NBS its numbers for trade have over the past few months had them come out differently.
According to the NBS, which is backed up by the Ministry of Commerce, China’s exports in March 2016 were $160.813 billion. That is the figure widely circulated last year in the media there as well as here. But the GAC today claims that total exports for March 2017 were $180.6 billion, which would have been an increase of only 12.3% when compared to that March 2016 figure.
| It may seem overly pedantic, but this discrepancy has been applied to the past few months, too. For January and February 2017, GAC estimated that exports rose 7.9% and then fell by 1.3%, respectively. Yet, using the data from the NBS, which largely agrees with the GAC figures from 2016, the growth rates were instead 3.1% in January and -4.8% in February. From these latter estimates, export growth for Q1 2017 as a whole, including the 12.4% growth in March, was just 4.2%.
As with all things economy this year, that figure is clearly an improvement from the -9.7% registered in Q1 2016 (both GAC as well as NBS), but nothing like the robust turnaround in “global growth” that is being described based on that 16.4%. |
China Exports, Jan 2008 - 2017(see more posts on China Exports, )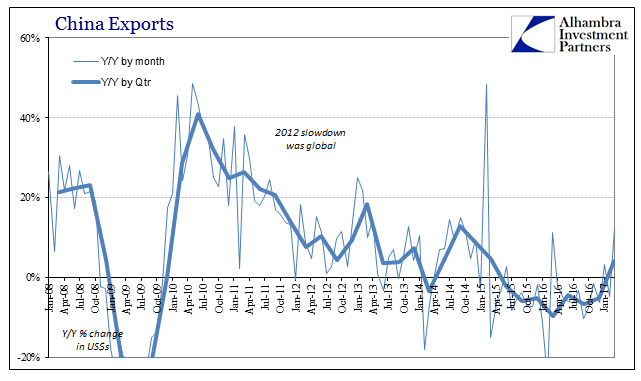 - Click to enlarge |
| It’s also very curious that the Chinese estimates on the import side are not so discordant. The GAC estimates that inbound trade into China expanded by 20.3% in the latest month to $156.6 billion, but given that imports were $130.956 billion in March 2016 that works out to a far more similar growth rate of 19.6%. It is possible that GAC has significantly revised its data set, especially, it would seem, on the export side, but any such conceivable revisions remain curiously absent at the Ministry of Commerce or NBS.
The extent of the import rebound, regardless of whichever rate it might truly be, is being driven by the commodity price rebound, and will therefore work out like calculated inflation rates around the world – a temporary burst that will get far too many people’s (meaning: economists) hopes up unnecessarily. Crude oil imports were up 99%, while imports of iron ore surged by 101%. As the base effects pass for each and almost every one, like the US CPI or European HICP, China’s imports will decelerate in terms of its year-over-year comparisons. |
China Imports, Jan 2008 - 2017(see more posts on China Imports, )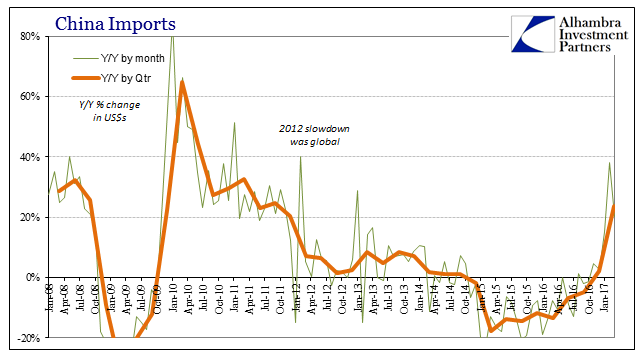 - Click to enlarge |
| One compelling piece of corroboration for this more subdued view was Chinese inflation. The NBS reported yesterday that for the second month in a row consumer prices increased less than 1% year-over-year. Despite a massive amount of RMB liquidity being added by the PBOC, that fiat expansion has not leaked out into consumer prices because like the rest of the world it was swallowed up by “dollar” declines which in China’s case are directly stated on the balance sheet of its central bank. |
China Cunsumer Price Index, March 2007 - 2017(see more posts on China Consumer Price Index, )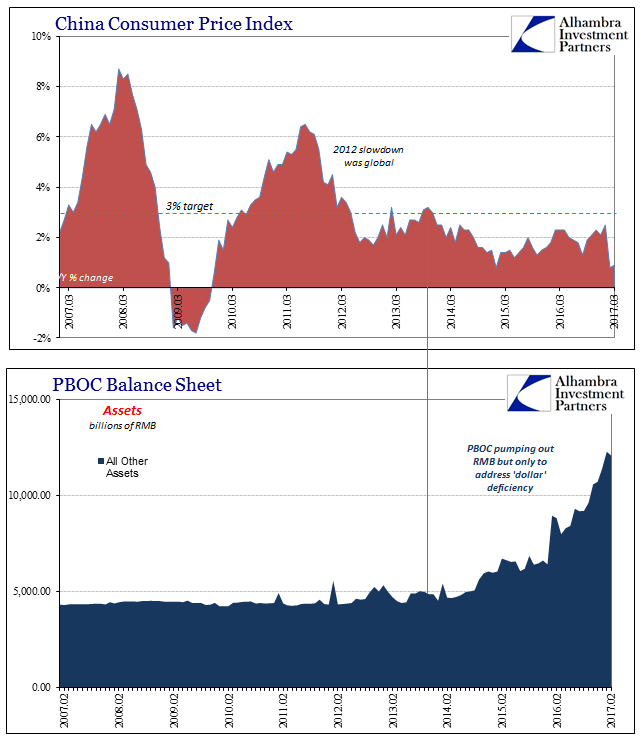 - Click to enlarge |
| The last time China’s CPI rate was below 1% for two consecutive months was October and November 2009. This time the low level of inflation is attributable to a substantial decline in food prices as base effects in that segment turned food inflation into a -4.4% headline drag. Ex food and energy, the CPI expanded by 2% in March, a full percentage point (still) less than the PBOC’s National Congress mandate.
China’s economic statistics are by their very nature hugely variable. In February 2015, exports jumped by 48.5% during a time in which the Chinese as global economy was sharply slowing (and in many places, especially the trade of goods, contracting). For Q1 exports to expand by less than 5% is actually disappointing, leaving them 6% less than Q1 2015 and almost 2% below Q1 2014. It would appear to indicate, as the CPI, the same low amplitude, low-growth state merely all over again switched back to the plus side. |
People's Bank of China Balance Sheet, Feb 2006 - 2017(see more posts on People's Bank of China, )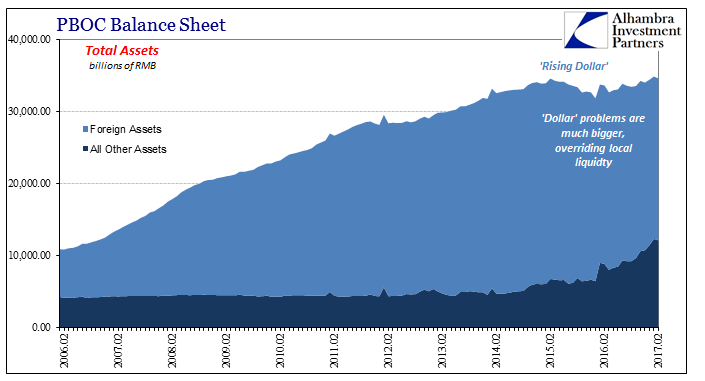 - Click to enlarge |
Tags: China,China Consumer Price Index,China Exports,China Imports,currencies,depression,dollar,economy,EuroDollar,exports,Featured,Federal Reserve/Monetary Policy,global trade,imports,Markets,newslettersent,People's Bank of China,statistical discrepancy,statistics,Trade,Trade Balance