Industrial Production in the United States was flat in January 2017, following in December the first positive growth rate in over a year. The monthly estimates for IP are often subject to greater revisions than in other data series, so the figures for the latest month might change in the months ahead. Still, even with that in mind, there is no acceleration indicated for US industry. After suffering through a more than yearlong slump, and for the manufacturing segment two years, there really should be. That there isn’t any is indicative of the same lack of meaningful change as we find in other economic accounts. Emerging from the dot-com recession, for example, IP proposed straight acceleration out of the contraction; beginning 2002 at -3.7% for January that year and then, in order, -3.1%, -2.1% -1.5%, -0.4%, +1.2%, +1.5%, and +1.7% for August 2002. U.S. Industrial Production Jan 2000 - Jan 2017(see more posts on U.S. Industrial Production, ) - Click to enlarge The seasonally-adjusted index level after bottoming out in March 2016 and hinting briefly at possible acceleration by July has instead followed the usual seasonal pattern and stalled out. The index estimate for January 2017 is almost exactly the same as July 2016. U.S. Industrial Production Jan 2006 - Jan 2017(see more posts on U.S.
Topics:
Jeffrey P. Snider considers the following as important: auto assemblies, automobiles, capacity utilization, capex, consumer goods, consumers, currencies, Dollar, economy, EuroDollar, Featured, Federal Reserve/Monetary Policy, industrial production, manufacturing, Markets, Mining, newslettersent, Oil, oil production, Output Gap, QE, Recession, recovery, stimulus, The United States
This could be interesting, too:
Nachrichten Ticker - www.finanzen.ch writes Die Performance der Kryptowährungen in KW 9: Das hat sich bei Bitcoin, Ether & Co. getan
Nachrichten Ticker - www.finanzen.ch writes Wer verbirgt sich hinter der Ethereum-Technologie?
Marc Chandler writes March 2025 Monthly
Mark Thornton writes Is Amazon a Union-Busting Leviathan?
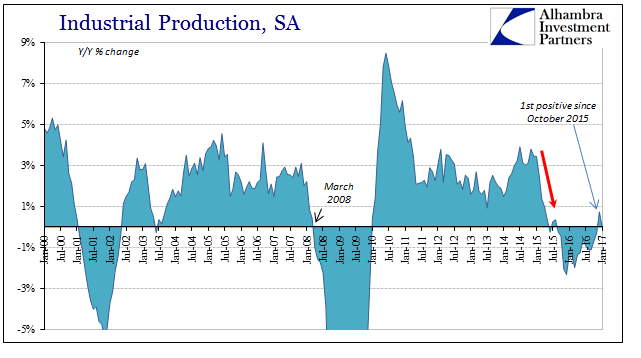
| Industrial Production in the United States was flat in January 2017, following in December the first positive growth rate in over a year. The monthly estimates for IP are often subject to greater revisions than in other data series, so the figures for the latest month might change in the months ahead. Still, even with that in mind, there is no acceleration indicated for US industry. After suffering through a more than yearlong slump, and for the manufacturing segment two years, there really should be. That there isn’t any is indicative of the same lack of meaningful change as we find in other economic accounts.
Emerging from the dot-com recession, for example, IP proposed straight acceleration out of the contraction; beginning 2002 at -3.7% for January that year and then, in order, -3.1%, -2.1% -1.5%, -0.4%, +1.2%, +1.5%, and +1.7% for August 2002. |
U.S. Industrial Production Jan 2000 - Jan 2017(see more posts on U.S. Industrial Production, ) |
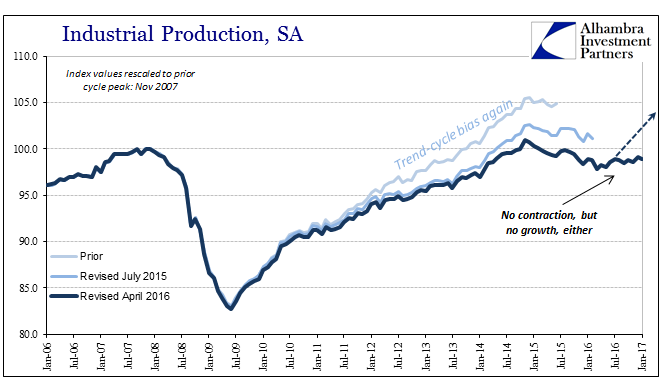
| The seasonally-adjusted index level after bottoming out in March 2016 and hinting briefly at possible acceleration by July has instead followed the usual seasonal pattern and stalled out. The index estimate for January 2017 is almost exactly the same as July 2016. |
U.S. Industrial Production Jan 2006 - Jan 2017(see more posts on U.S. Industrial Production, ) |
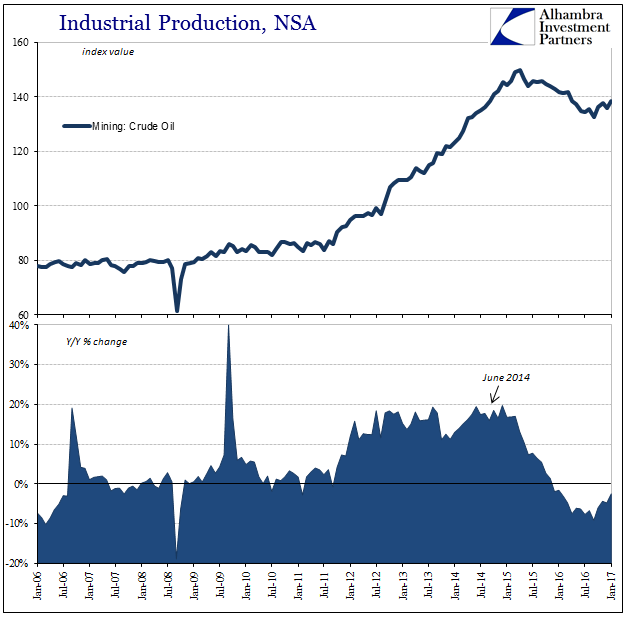
| This has occurred despite contributions again, on a month-to-month basis, from the oil sector. Going back to September, IP in this subcategory is up more than 4% to last month. Year-over-year production related to the mining for crude oil is down just 2.5% after falling at a nearly 10% rate in September. |
U.S. Industrial Production, NSA Jan 2006 - Jan 2017 |
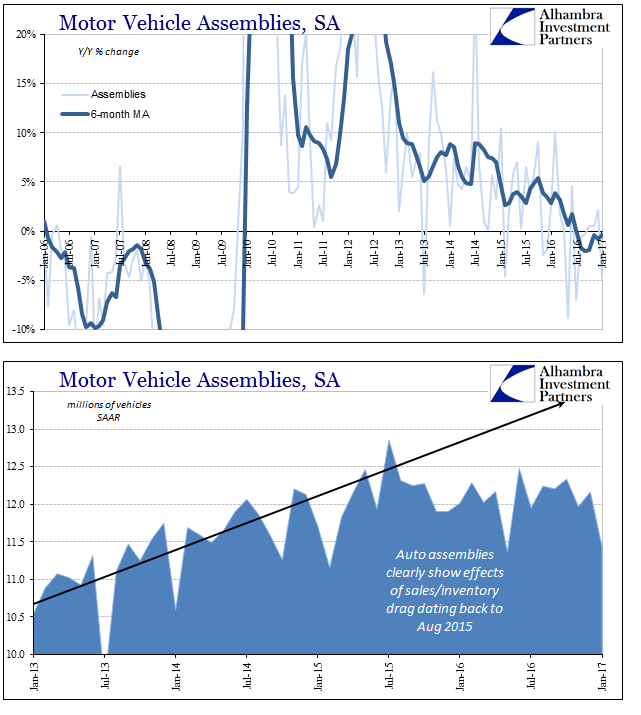
| The lack of acceleration for US industry appears to be related in good part to domestic automobile production. Again, revisions might seriously change the monthly estimate, but as of the current figure auto assemblies for January were alarmingly low all over again. At just 11.42 million (SAAR), that nearly matched the lowest level (May 2016) of this break in the prior trend dating back to August 2015. |
Motor Vehicle Assemblies, SA |
| Retail sales for automobiles had slightly improved in the latter half of last year, but clearly nowhere near enough to offset inventory levels accumulated during what amounted to a near-recession at the start of 2016. Automakers don’t appear to be yet enamored with the prospect for having dodged a possible recession, certainly not responding as if that case was meaningful in terms of a return to growth.
|
U.S. Industrial Production: Consumer Goods |
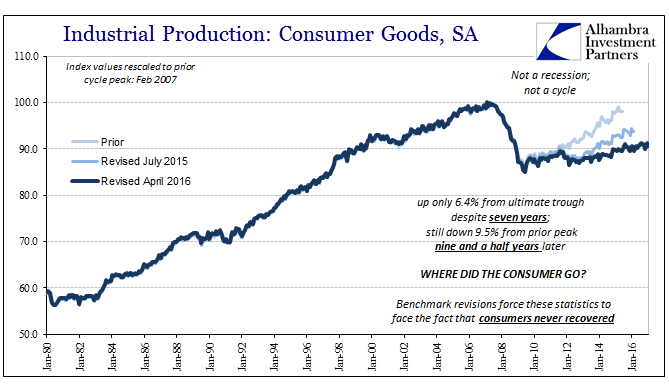
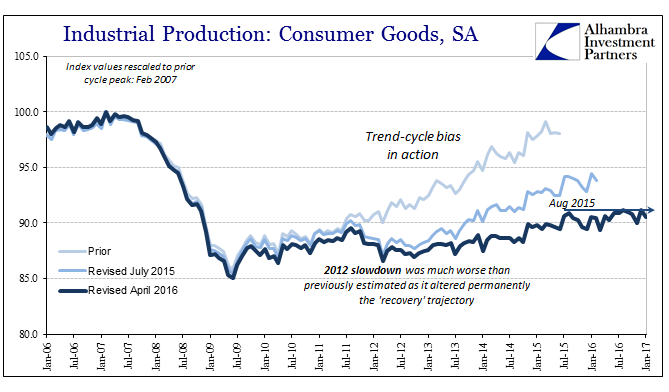
| Industrial production for consumer goods has been more or less similarly stuck, though given the utter lack of recovery since 2009 (despite clear recovery in automobiles during that time) it is difficult to distinguish more awful from the merely dreadful. It is these qualifications that actually matter. |
U.S. Industrial Production: Consumer Goods, Jan 2006 - Jan 2017 |
| Dating back to the arrival of “global turmoil” in the late summer of 2015, coincident to the shift in auto assemblies, the IP index for the production of consumer goods has been flat. The level for January 2017 is 0.5% less than the level from August 2015. |
U.S. Capacity Utilization, 2011 - 2017 |
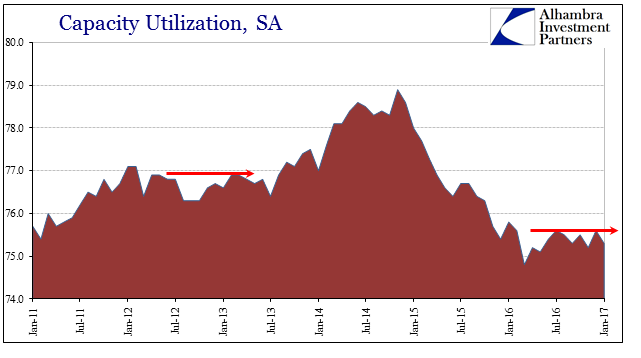
| Not surprisingly, then, capacity utilization seems to have hit a ceiling (or floor, depending upon your outlook) where again no acceleration of activity is indicated. It is instead the same condition repeated once more only from a lower level this time as compared to 2012. Shallow contraction yielding to shallow growth is not a transition to growth but all contraction. That the positive numbers are uneven and not uniformly distributed only furthers this point. The economy is not healed having sidestepped possible recession last year, nor is it actually healing. It merely shifts between variable conditions of the same stagnation. |
Potential Real GDP 1999Q1 - 2019Q1 |
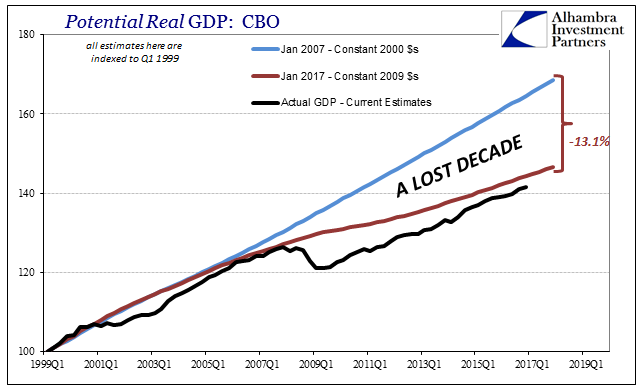
| Changing this set of economic circumstances would require something far more than doing more of the same differently. Even the Fed would agree, and has more subtly, that further “stimulus” even of the fiscal variety is not likely to do much. They make that determination from what they believe is a closed output gap (having no good idea how it closed), which is as good as any representation for what is truly wrong here. An economy doesn’t just shrink like it did in the Great “Recession” – proving that it wasn’t a recession.
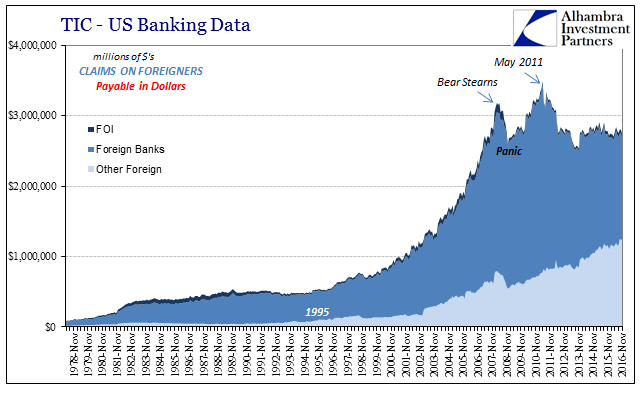
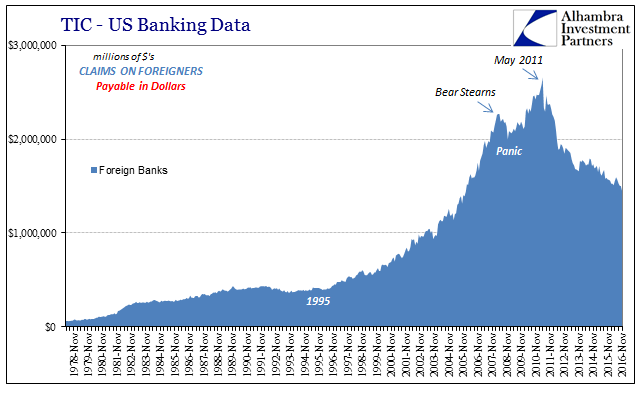
A more proper term for it would be dislocation, as in the Great Dislocation which would indicate both a durable rupture but also that it could at some point, like a joint on the human body, be set back into place. The way to do that isn’t infrastructure spending or the possible, eventual repeal of Obamacare, it is what matches perfectly the before and after; there was steady and robust eurodollar growth before, and none after; there was worldwide and in some places (EM’s) robust economic expansion before, and none worldwide after. |
TIC - U.S. Bank Data 1978 - 2016 |
| That correlation doesn’t suggest “stimulus” so much as putting a stop to “stimulus.” It didn’t accomplish anything before and there is a much better case to make that it might have helped make it worse. The Fed, at least, has thrown in the towel on recovery but that only means the actual answers lie in changing out the Fed. Until that happens, what you see immediately above will only continue and therefore also the lack of acceleration across the real economy; at least until the next “dollar” event queues. |
TIC - U.S. Banking Data 1978 - 2016 |
Tags: auto assemblies,automobiles,capacity utilization,capex,consumer goods,consumers,currencies,dollar,economy,EuroDollar,Featured,Federal Reserve/Monetary Policy,industrial production,manufacturing,Markets,Mining,newslettersent,OIL,oil production,Output Gap,QE,recession,recovery,stimulus

