We’re pleased to republish this guest post by Paul Belanger. Paul is the author and owner of the website, Evidence Based Wealth, and the YouTube channel belangp, where he’s published over 10 years of research and analysis of gold. He’s also the author of Evidence Based Wealth: How to Engineer Your Early Retirement, available for purchase at Amazon.com. This post does not necessarily reflect the views of Monetary Metals. In my last article and video I discussed the nature of investment. As Benjamin Graham has stated “An investment operation is one which, upon thorough analysis, promises safety of principal and a satisfactory return. Operations not meeting these requirements are speculative.” Hopefully I successfully convinced you that because of repeated changes to
Topics:
Monetary Metals considers the following as important: 6a.) Monetary Metals, 6a) Gold & Monetary Metals, blog, Featured, Gold Exchange Report, newsletter
This could be interesting, too:
Clemens Schneider writes Café Kyiv
Clemens Schneider writes Germaine de Stael
Clemens Schneider writes Museums-Empfehlung National Portrait Gallery
Clemens Schneider writes Entwicklungszusammenarbeit privatisieren
We’re pleased to republish this guest post by Paul Belanger. Paul is the author and owner of the website, Evidence Based Wealth, and the YouTube channel belangp, where he’s published over 10 years of research and analysis of gold. He’s also the author of Evidence Based Wealth: How to Engineer Your Early Retirement, available for purchase at Amazon.com. This post does not necessarily reflect the views of Monetary Metals.
In my last article and video I discussed the nature of investment. As Benjamin Graham has stated “An investment operation is one which, upon thorough analysis, promises safety of principal and a satisfactory return. Operations not meeting these requirements are speculative.” Hopefully I successfully convinced you that because of repeated changes to the definition of “the dollar” one cannot ever be 100% satisfied that the lending of “dollars” is an investment operation. One can never be certain that the principal being returned is the same as what was lent. In fact, we have ample history demonstrating that the principal will be debased over the course of years, sometimes suddenly, sometimes gradually. Lending dollars is therefore inherently speculative. Sometimes the speculation can be a good one. Sometimes it can be bad. It’s up to us to determine the odds of success. In this article and video I will be discussing the odds of speculation in bonds being favorable today.
Purchases of corporate equities are also speculative in nature because the corporation is under no obligation to return the capital. There are situations when the odds of a satisfactory outcome can be favorable. For example, expected dividend income over a given time horizon can be high enough that a person will be better off having bought corporate equities even if the equities are later sold at an unfavorable price. I will be discussing the odds of equity speculation as well.
The only true operation I have come across that can satisfy the definition of an investment operation is the leasing of gold and silver. With such an operation one can put in place safeguards to ensure the return of the gold or silver lent, and that gold and silver will be indistinguishable from what was lent. I will not be discussing such an operation today, but sometime in the future I might.
What’s important to recognize are the implications. The only truly valid unit of account in today’s world are ounces of gold and ounces of silver. We can choose to lend them under contracts containing a gold or silver clause. We can choose to convert them to dollars and speculate in dollar loans or equity purchases. Or we can simply safely store them and wait for an interesting opportunity to arise. Regardless of what we decide to do, it is gold and silver in hand (or in storage but not lent) that represents non-lent capital and so gold and silver in hand should be considered the default position for any holder of wealth. Currency loans and equity investment should be considered speculations. It is the merit of such speculation that should be evaluated before one parts with their gold and silver. This is not to say that the purchasing power of an ounce of gold or an ounce of silver is constant. We know this is certainly not the case! However, gold and silver are the only assets that can be returned to the owner in such a form that there is no question that the owner is receiving their capital back and so gold and silver can be considered better measurements to use for gauging the merits of an investment or speculation. In this work I will be using gold as the unit of account for measuring the merits of dollar loans and equity purchases.
| US Bonds Relative to Gold
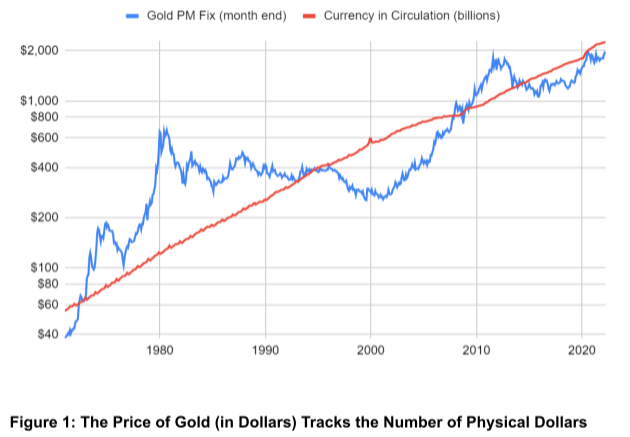
If you have followed my work you will no doubt have seen the chart shown as Figure 1. Over the course of the decades following President Nixon’s closing of the gold window, the dollar price of an ounce of gold has risen along with the amount of physical currency that has been printed. I will not discuss the reason why here because I have done so many times in past works. But is this really the price of gold we are tracking? Not really. It is really a reflection of the value of the dollar expressed in the better unit of account, gold. All one needs to do is flip the gold price upside down to obtain the price of the dollar in gold. Dollars per ounce becomes ounces (or any other weight of gold) per dollar. The relationship between the value of the dollar expressed in gold and the amount of dollars in existence isn’t one to one. Obviously there are many factors at play, such as confidence, economic conditions, etc. But we can see that over the long term additional dollars printed has put downward pressure on the price of the dollar in gold (or upward pressure on the price of gold in the dollar if one insists upon using the dollar as a unit of account). Can we use the relationship between gold and currency in circulation to estimate whether the dollar, as a speculation, is likely to appreciate or depreciate relative to gold? What’s more, can we use it to estimate the rate at which this appreciation or depreciation is likely to occur? I believe the answer to these questions is yes. |
 . |
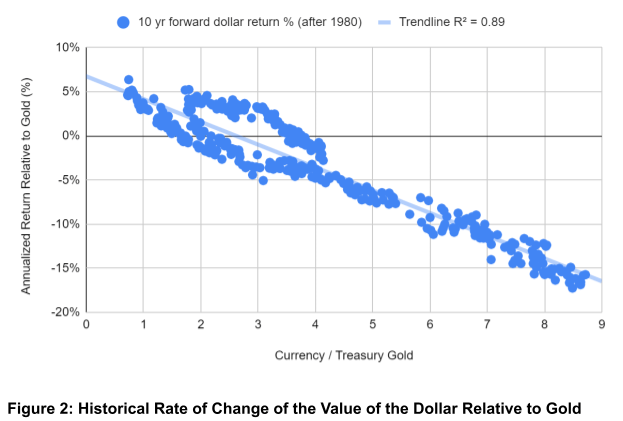
| Figure 2 shows the annualized rate of change of the value of the dollar relative to gold for various 10 year holding periods starting in 1980. It is true that we’ve only had 4 non-overlapping periods of time since then; however, if one were to pick any starting point at random these were all possible results. The annualized rates of change are plotted against the ratio of currency in circulation to the market value of US Treasury held gold. Those who have followed my work know why I think this is a relevant variable. As can be seen the relationship is linear and a linear model does a good job of explaining the variability in the data. The R squared value, also known as the coefficient of determination, is a statistical measure of the amount of the data variance that can be explained with a model. In this case, 89% of the variance in annualized returns can be explained using the ratio of currency outstanding relative to Treasury held gold.
Why not use all of the data available from 1971 onward? The reason has to do with futures markets. Gold futures started trading on the COMEX in 1975, but it was not until 1980 that the volume of trading activity ramped up significantly. If we were to consider the data prior to 1980 we would see that it also follows a well defined trend, but the behavior is distinctly different before and after the onset of gold futures market trading. Since we are living in a time of significant futures market trading activity, we must use the data after 1980 and not before. 10 years? Many people don’t care nearly as much about 10 years from now as they do 10 months from now, 10 weeks from now, or even 10 hours from now! Is this relationship valid for shorter time periods? Unfortunately not. I looked at annualized returns over 5 year periods and the R squared value was only 0.504. The relationship is still descriptive, but for my wealth I’d much prefer a correlation that explains 89% of the variability than 50% of the variability. It’s even worse for 1 year rates of change. The R squared value for this short period of time is only 0.14. Such a relationship is hardly useful. So we’re left with a relationship that can be used to form an educated guess about the annualized rate of change of the dollar relative to gold over the coming decade. Right now the ratio of currency in circulation to the market value of Treasury gold is 4.7. The model suggests that if the past relationship holds the dollar is likely to depreciate in value relative to gold at a rate of about 5.4% per year. Wait a minute! Nobody is going to simply put dollar bills in a safe and keep them there for 10 years! They are going to lend them out and collect interest! Gold doesn’t pay interest, as we are often reminded. That’s right! Money doesn’t pay interest! What kind of an interest rate would a person need to realize in order to be reasonably assured that owning a 10 year bond will produce a superior result to simply holding gold in a safe location? 5.4% seems like the right answer, but that ignores the impact of taxes. In reality it would require a 10 year interest rate greater than 5.4% for the currency loan to look attractive relative to simply owning gold. Right now the 10 year Treasury Note yields just slightly more than 3%. This would suggest to me that interest rates need to rise a couple of percent more before bonds become an attractive speculation. |
 . |
| US Stocks Relative to Gold
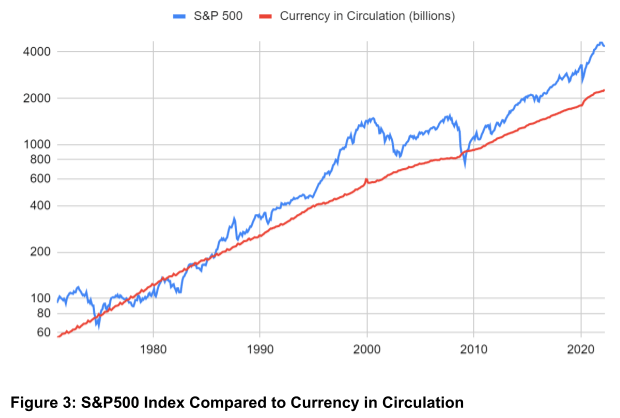
How about equities? How should one go about determining if an investment in equities is a good speculation? It might surprise many to learn that the price change of the S&P500 index over the past 5 decades can be largely explained by the change of the supply of currency (just as was the change of the price of gold, which is really just a reflection of the change in the value of the dollar). Figure 3 illustrates this clearly. When the trend of the S&P500 price and the trend of currency in circulation are analyzed, one finds that the yearly nominal growth of the S&P500 index has been 8.16%. The 90% confidence limits of the growth rate are 8.03%/yr on the low end and 8.28% on the high end. Currency in circulation has grown by 7.24%/yr. The 90% confidence limits on its growth rate are 7.20%/yr on the low end and 7.28% on the high end. |
 . |
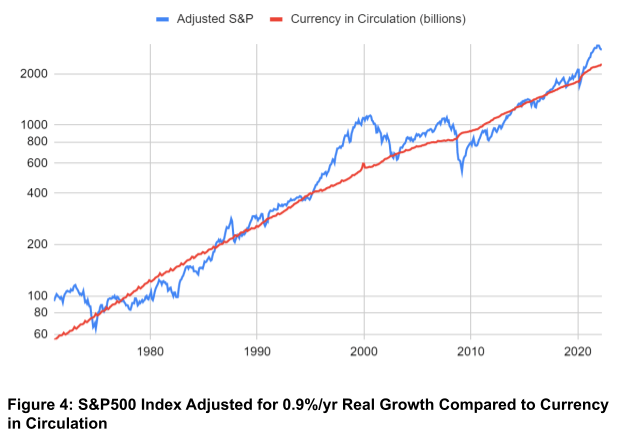
| On average, the S&P500 index has increased at a rate that is only 0.9% per year greater than the rate of growth of the currency. One explanation for this is that speculative forces are the cause of the difference. Another is that corporations in the US have managed to produce real growth of 0.9% per year. When I say real growth is 0.9% what I’m implying is that the 7.24% per year rate of growth of the currency is an inflationary component and that real profits have exceeded this inflationary component by 0.9%. I’m inclined to give corporate America the benefit of the doubt that they’ve been able to produce true growth of 0.9% per year.
Let’s adjust the S&P500 price index by 0.9% per year to estimate what a fair price might be without the 0.9% real growth. Doing so will demonstrate a means by which we can fairly compare the S&P500 against gold. The reason for this is that a popular metric many use is the Dow to gold ratio or the S&P500 to gold ratio. While these might be interesting metrics, they fail to consider the real growth corporations produce. We must take into consideration this real growth when comparing current S&P500 pricing in gold against levels of the past. Figure 4 demonstrates the currency inflation effect on the S&P500. The adjusted S&P500 figure is the price index less a 0.9% per year growth rate. This adjusted index reflects the impact of currency inflation on S&P500 pricing levels. The match is quite good. It provides a level of comfort that if we divide this adjusted S&P500 index by the price of gold (which itself is mainly a reflection of currency inflation), we will obtain a reflection of the real price of the S&P500 in gold that can be used to estimate long term returns. |
 . |
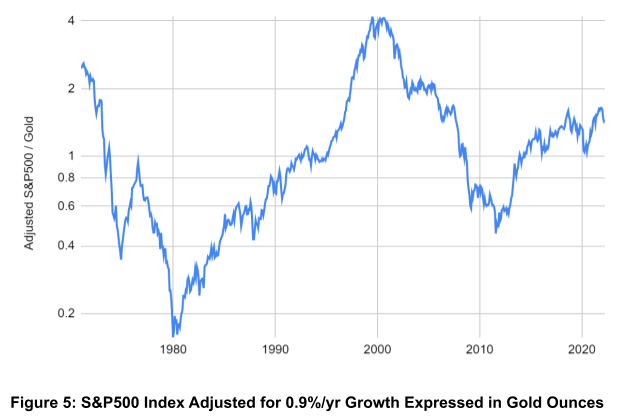
| Figure 5 shows what for many is the familiar ratio of the S&P500 to the price of gold with one twist, that the S&P is adjusted downward to adjust for a 0.9% per year real growth rate. This makes the comparison of this equity index to gold more useful. Now, the critical question is whether this ratio can be used to estimate the likely relative return of equities to gold. Just was was done for the dollar, we can look to the past to see if there is a relationship between actual 10 year returns (in gold) against the ratio shown in Figure 5. Again, I will focus on the years after 1980 to take into account the emergence of the COMEX futures market. |
 . |
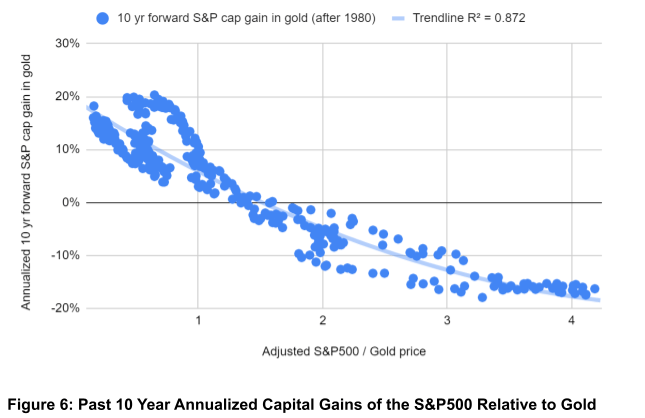
| As shown in Figure 6, the ratio of adjusted S&P500 to the price of gold explains most of the 10 year relative returns. The R squared value tells us that 87% of the variability is explained by this single factor. This is almost as high as the descriptive power of currency in circulation to Treasury gold for explaining decade long changes in the gold price, which if you recall was 89%.
So, if the past is prologue (which it’s never guaranteed to be), what can we expect from stocks going forward relative to gold? The S&P500 index is currently 4119. It’s growth adjusted value is 2602. At the time of this writing the gold price is $1853 per ounce. This results in an adjusted ratio of 1.4. According to past results the long term capital gain rate of the S&P500 expressed in gold has been about 1.1% per year when starting at this level. This includes the 0.9% per year real growth rate, but does not include dividends. If we add in an additional 1.3% to account it suggests the S&P500 may perform at a level of about 2.4% per year when expressed in terms of gold ounces. Is this guaranteed? No, but such is the nature of speculation. All we can do is take an educated guess. |
 . |
A 2.4% rate of return is not trivial, after all it means increasing one’s wealth by about 27% over the span of a decade, but it is nowhere near as interesting as the returns likely to be experienced when the dollar is used as the unit of account. This is an absolutely critical point one needs to understand and one that I am continuously trying to argue. Nominal gains expressed in dollars are illusory. They include a 7.5% per year rate of increase in the number of currency units. This inflation in the currency supply may not affect the prices of all goods and services uniformly, and the many goods will not climb at a rate of 7.5% per year due to enhancements in productivity, but the inflation effect is very real. Seeing things through the lens of gold as a monetary unit makes equity and bond returns much less attractive than they otherwise might look.
Everyone must make their own decisions. My personal decision right now is to maintain enough dividend paying equities to supply needed cash flow, minimize bond holdings to what is needed to fund a few months of expenses, and save the rest in gold. If interest rates rise by more than a couple percent or the ratio of the S&P500 to gold drops another 30% I will re-evaluate this position. Until that time I’m happy to simply sit on my excess capital waiting for an opportunity to arise. As we know from the past, they always do.
Make sure to subscribe to our YouTube Channel to check out all our Media Appearances, Podcast Episodes and more!
Additional Resources for Earning Interest on Gold
If you’d like to learn more about how to earn interest on gold with Monetary Metals, check out the following resources:
In this paper we look at how conventional gold holdings stack up to Monetary Metals Investments, which offer a Yield on Gold, Paid in Gold®. We compare retail coins, vault storage, the popular ETF – GLD, and mining stocks against Monetary Metals’ True Gold Leases.
The Case for Gold Yield in Investment Portfolios
Adding gold to a diversified portfolio of assets reduces volatility and increases returns. But how much and what about the ongoing costs? What changes when gold pays a yield? This paper answers those questions using data going back to 1972.
You Might Also Like
 Investments, Speculations and Money by Paul Belanger
2022-06-24
We’re pleased to republish this guest post by Paul Belanger. Paul is the author and owner of the website, Evidence Based Wealth, and the YouTube channel belangp, where he’s published over 10 years of research and analysis of gold. He’s also the author of Evidence Based Wealth: How to Engineer Your Early Retirement, available for purchase at Amazon.com. This post does not necessarily reflect the views of Monetary Metals.
 Analysis Featured In Gold We Trust Report 2022
2022-06-11
For well over a decade, Ronnie Stoeferle has written the annual In Gold We Trust Report. Since 2013 it has been co-authored by his partner Mark Valek and has provided a holistic assessment of the gold sector and the most important factors influencing it, including interest rates, debt, central bank policy and fundamental analysis.
Monetary Metals CEO Keith Weiner Interviewed on RealVision
2022-06-03
CEO of Monetary Metals Keith Weiner sat down with Michael Green of RealVision to discuss how Monetary Metals increases gold’s value proposition by paying interest on gold and silver holdings and the inevitable debasement of fiat currencies. Keith and Mike discuss the inherent volatility of Bitcoin, Costco’s ability to maintain its price point, and the colossal meltdown of the Terra stablecoin.
 Open Letter to Lex Fridman and Michael Saylor
2022-05-19
Gentlemen: I am writing to you in response to your Podcast #276. The first thing I want to say is—well done! You talked about economics and money for four hours and attracted over two million viewers. The monetary system faces grave problems and discussing them is important.
 It’s Time for TINA to Retire
2022-04-25
To listen to the audio version of this article click here. In the world of trends, history repeats more than it rhymes. Things which were considered “in” decades ago, reemerge as cool again decades later. From mom jeans to vinyl records and even Marxist ideology. The spotlight of today turns to things—both good and bad—once forgotten.
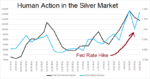 Human Action in the Silver Market
2022-03-29
We have recently seen an increase in social media posts about the big increase in short positions by the bullion banks. What would motivate them to short a commodity during this period of inflation, much less a monetary metal when central banks are printing money with reckless abandon? And doesn’t their shorting of silver push down the price?
 This is Not The Silver Breakout You’re Looking For!
2022-03-10
Every once in a while, one regrets not acting sooner, or not acting soon enough. In our case, we did not publish this Tuesday evening. We should have. Today the price is down, and others may also call for lower silver prices.
 The Zombie Ship of Theseus
2022-01-04
The Ship of Theseus is an old philosophical thought experiment. It asks a question about identity. Suppose you replace all of the boards of a ship with new ones—is it still the same ship? We are not going to try to resolve this millennia-old paradox. Instead, we are going to add one more element, and then tie it to the monetary system.
Tags: Blog,Featured,Gold Exchange Report,newsletter