Pater Tenebrarum
My articles My siteAbout meMy booksMy videos
Follow on:TwitterFacebook
Seeking Alpha
Money Supply Growth Continues to Decelerate Here is a brief update of recent developments in US true money supply growth as well as the trend in the ratio of industrial production of capital goods versus consumer goods (we use the latter as a proxy for the effects of credit expansion on the economy’s production structure). First, a chart of the y/y growth rate of the broad US money supply TMS-2 vs. y/y growth in industrial & commercial loans extended by US banks. Interestingly, we have once again seen a spike in commercial and industrial loan growth just as the growth rate of TMS-2 has slowed to a crawl. We have previously discussed why this tends to happen (see “A Scramble for Capital” for the details). What is
Topics:
Pater Tenebrarum considers the following as important: 6) Gold and Austrian Economics, 6b) Austrian Economics, 7) Markets, Central Banks, Featured, newsletter, On Economy
This could be interesting, too:
Nachrichten Ticker - www.finanzen.ch writes Die Performance der Kryptowährungen in KW 9: Das hat sich bei Bitcoin, Ether & Co. getan
Nachrichten Ticker - www.finanzen.ch writes Wer verbirgt sich hinter der Ethereum-Technologie?
Martin Hartmann writes Eine Analyse nach den Lehren von Milton Friedman
Marc Chandler writes March 2025 Monthly
Money Supply Growth Continues to DecelerateHere is a brief update of recent developments in US true money supply growth as well as the trend in the ratio of industrial production of capital goods versus consumer goods (we use the latter as a proxy for the effects of credit expansion on the economy’s production structure). First, a chart of the y/y growth rate of the broad US money supply TMS-2 vs. y/y growth in industrial & commercial loans extended by US banks. Interestingly, we have once again seen a spike in commercial and industrial loan growth just as the growth rate of TMS-2 has slowed to a crawl. We have previously discussed why this tends to happen (see “A Scramble for Capital” for the details). What is particularly interesting at the moment, is that growth in C&I lending seems to have peaked and is now turning down – this suggests that a sizable downturn in economic activity may be closer than is commonly assumed. |
US broad true money supply TMS-2 y/y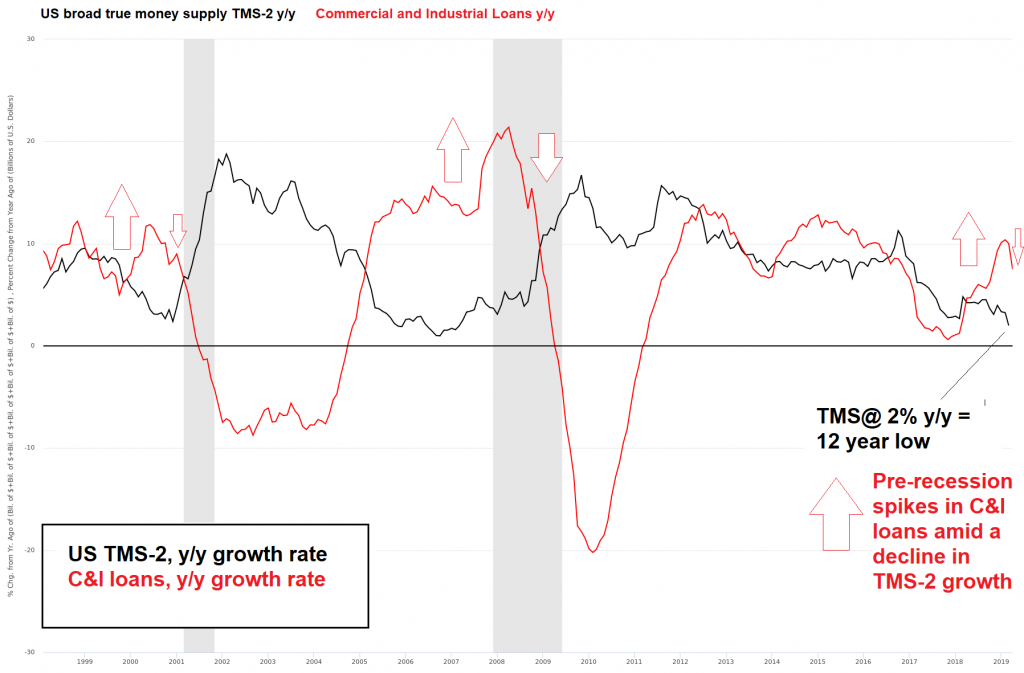 - Click to enlarge At the end of April, growth in US TMS-2 (black line) stood at a measly 2% y/y, which is well below the threshold traditionally required to maintain bubble conditions. The red line depicts y/y growth in C&I loans – and the recent slowdown may be significant. |
Impact on Economic ActivityThe next chart shows ISM new orders vs the y/y change in the dollar value of new factory orders for all manufacturing goods and for non-defense capital goods excluding aircraft, lagged by 6 months. All three series have turned down noticeably. Evidently the effects on the real economy one would expect due to the slowdown in money supply growth are finally beginning to emerge. This brings us to the ratio of capital vs. consumer goods production. The ratio serves as an illustration of the business cycle – as credit expands and interest rates decline, resources increasingly shift toward the higher stages of the production structure (capital goods) to the detriment of the lower stages (consumer goods). If this shift is driven by credit expansion from thin air rather than being supported by an increase in real savings, a sizable part of these investments will turn out to be malinvestments. The lengthened production structure will turn out to be unsustainable, as the wherewithal to complete it as planned does actually not exist. A large part of the accounting profits reported by industries that have benefited the most from the boom will turn out to have been illusory, having in reality masked capital consumption. |
National ISM new orders vs Value of factory orders, 1994-2019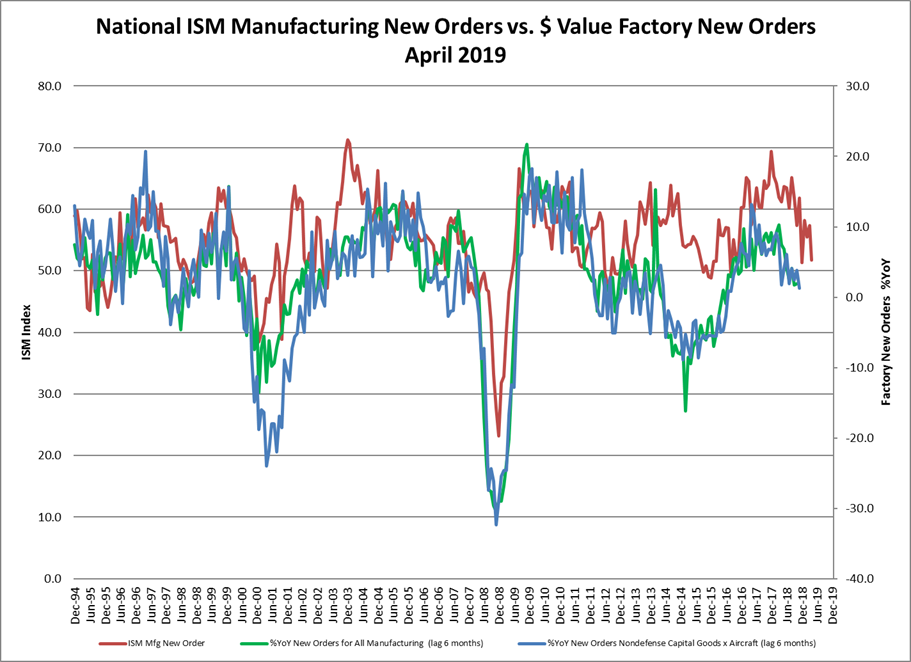 - Click to enlarge ISM new manufacturing orders (red line) vs. the y/y change in the dollar value of new factory orders for all manufacturing goods (green line) and non-defense capital goods excluding aircraft (blue line), lagged by 6 months. Chart via our friend Michael Pollaro (readers who are not familiar with the TMS-2 money supply measure shown above may want to check out Michael’s excellent article on the topic at Forbes). |
| As a result, the production structure has to be rearranged, which tends to coincide with a bust. During this adjustment period many of the long-term projects envisaged and begun during the boom have to be abandoned and the production structure is shortened in order to come back in line with the actual time preferences of consumers and the state of the pool of real funding (i.e., the actual amount of real savings available to fund production).
The question is of course if the recent downturn in the ratio is actually significant, or if the sideways move will ultimately continue. Given the end of “QE” by the Fed and the ECB and the marked slowdown in TMS-2 growth, the probability that this downturn will indeed turn out to be significant is quite high, even though a number of other recession warnings still remain absent. These warning signals often appear with very little lead time (a market-based signal worth watching for was recently discussed by Mish – namely the reversal of the yield curve from inversion to a rapid steepening). We should mention that the ratio of capital vs. consumer goods production is of course a fairly simplistic indicator considering the complexity of the economy’s capital structure (readers not familiar with Austrian capital theory may want to check out this brief overview: “The Production Structure”). However, it does mirror booms and busts, and as such we definitely consider it useful. As an aside to this, we plan to soon post some additional background information on this topic, in particular on Friedrich Hayek’s discussion of why an increase in interest rates from artificially depressed levels as a rule does not scotch a boom immediately – despite the fact that it makes a great many long-term investment projects as a rule no longer appear to be economically viable. Apart from the well-known fact that it takes time for newly created money to percolate through the economy, Hayek shows that there are also other reasons for this lag. |
Capital vs Consumer Goods Production Ratio, 1990-2019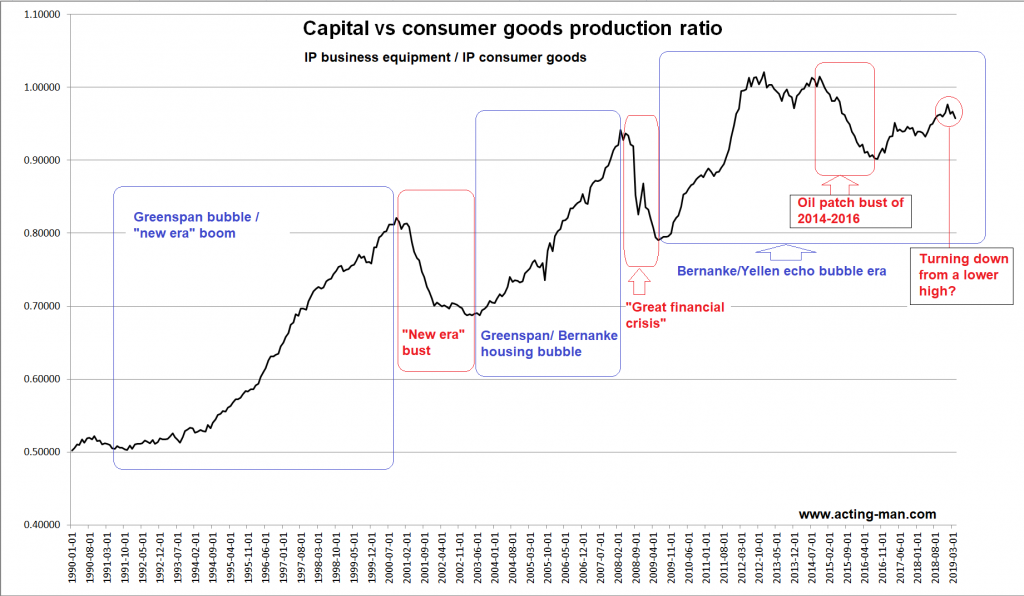 - Click to enlarge Boom and bust mirrored by the ratio of capital vs consumer goods production. The ratio has moved sideways at an elevated level for an unusually long period of time, but it seems it is now beginning to decline from a secondary peak. |
ConclusionIt has taken quite a long time already, but it appears as though slowing money supply growth is finally beginning to affect the real economy. The stock market is usually considered a leading indicator of the economy, but this lead time has become ever shorter in recent decades and we believe this may well be the case in the next downturn as well. As a final remark, price inflation may actually become an unexpected problem. Asset price inflation was driven by QE, which first and foremost directly impacted financial markets. It stands to reason that a lot of money remains “trapped” in the financial markets, but as we have pointed out previously, it eventually always leaks out. It is noteworthy in this context that several of the so-called “trimmed” CPI measures have been above the Fed’s 2% target for PCE for quite some time, as this chart put together by Morgan Stanley illustrates: While it is not clear yet which price inflation measure will “win out”, this is something worth keeping an eye on, as it could keep the Fed from resuming monetary pumping for a while, even if an economic downturn becomes obvious. |
Trimmed CPI measures remained above the 2%Y mark over the recent past, 2010-2019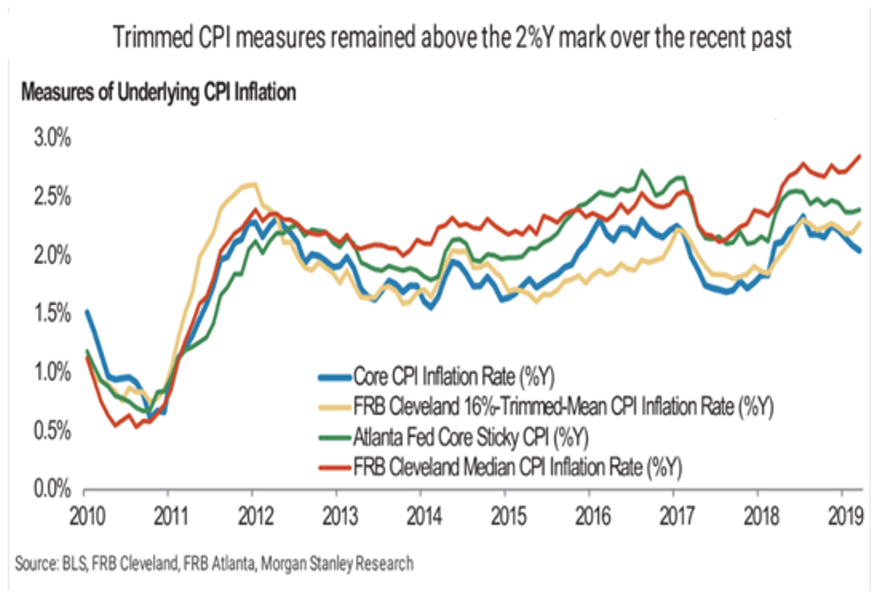 While “core CPI” (i.e., PCE) has turned down again, the Cleveland Median CPI has recently broken out to a new high for the move. - Click to enlarge |
Charts and data by: St. Louis Fed, Michael Pollaro, acting-man.com, Morgan Stanley, Atlanta Fed, Cleveland Fed
Tags: central banks,Featured,newsletter,On Economy