USD/CHF seesaws near two-week high amid overbought RSI conditions. A confluence of six-day-old rising trend-line, 4H 200MA adds to the resistance. The USD/CHF pair’s one-week-old recovery seems to fade as the quote seesaws near 0.9814 during the Asian session on Tuesday. Not only repeated failures to cross 50% Fibonacci retracement of current month declines but overbought conditions of 14-bar relative strength index (RSI) also increases the odds of its pullback. With this, sellers can target immediate trend-line support, at 0.9790, whereas 0.9750, 0.9690 and monthly bottom close to 0.9660 will please them afterward. On the upside, pair’s rise beyond 50% Fibonacci retracement of 0.9820 will confront 200-bar moving average on the four-hour chart (4H 200MA) and
Topics:
Anil Panchal considers the following as important: 4) FX Trends, 4.) FXStreet, Featured, newsletter
This could be interesting, too:
RIA Team writes The Importance of Emergency Funds in Retirement Planning
Nachrichten Ticker - www.finanzen.ch writes Gesetzesvorschlag in Arizona: Wird Bitcoin bald zur Staatsreserve?
Nachrichten Ticker - www.finanzen.ch writes So bewegen sich Bitcoin & Co. heute
Nachrichten Ticker - www.finanzen.ch writes Aktueller Marktbericht zu Bitcoin & Co.
The USD/CHF pair’s one-week-old recovery seems to fade as the quote seesaws near 0.9814 during the Asian session on Tuesday. Not only repeated failures to cross 50% Fibonacci retracement of current month declines but overbought conditions of 14-bar relative strength index (RSI) also increases the odds of its pullback. With this, sellers can target immediate trend-line support, at 0.9790, whereas 0.9750, 0.9690 and monthly bottom close to 0.9660 will please them afterward. On the upside, pair’s rise beyond 50% Fibonacci retracement of 0.9820 will confront 200-bar moving average on the four-hour chart (4H 200MA) and nearly a week-long ascending trend-line at 0.9835/37. If at all prices manage to rally above 0.9837, 61.8% Fibonacci retracement near 0.9855 and 0.9880 can lure buyers. |
USD/CHF 4-hour chart, August 20(see more posts on USD/CHF, )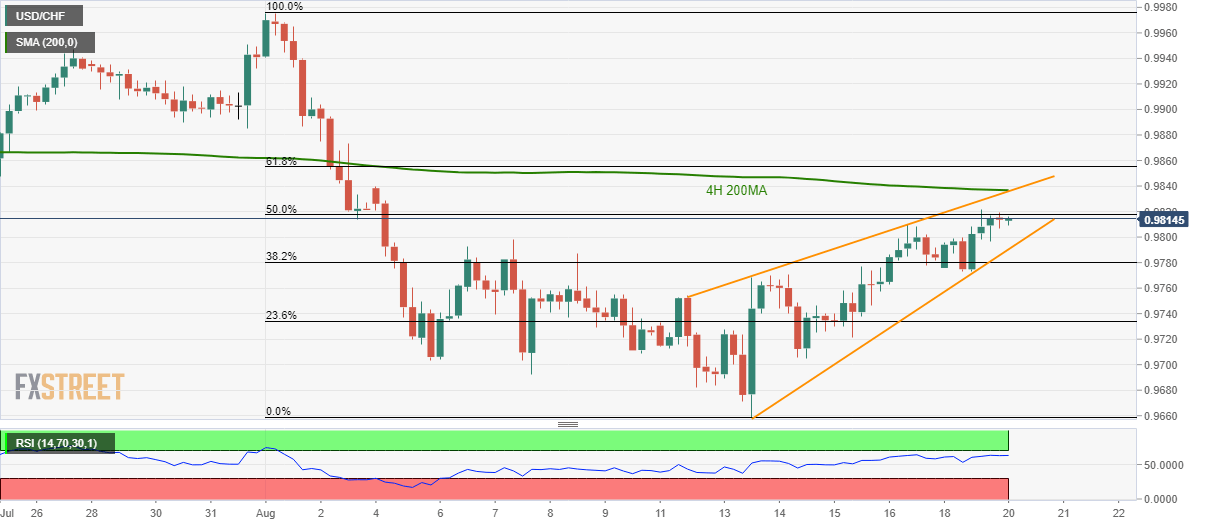 - Click to enlarge |
Trend: Pullback expected
Tags: Featured,newsletter