We do not like Purchasing Power or Real Effective Exchange Rate (REER) as measurement for currencies. For us, the trade balance decides if a currency is overvalued. Only the trade balance can express productivity gains, while the REER assumes constant productivity in comparison to trade partners. Who has read Michael Pettis, knows that a rising trade surplus may also be caused by a higher savings rate while the trade partners decided to spend more. This is partially true. Recently Europeans started to increase their savings rate, while Americans reduced it. This has led to a rising trade and current surplus for the Europeans. But also to a massive Swiss trade surplus with the United States, that lifted Switzerland on the U.S. currency manipulation watch list. To
Topics:
George Dorgan considers the following as important: 2) Swiss and European Macro, 2.) Trade Balance News Service Bunt [FR], Featured, newsletter, Switzerland Exports, Switzerland Exports by Sector, Switzerland Imports, Switzerland Imports by Sector, Switzerland Trade Balance
This could be interesting, too:
RIA Team writes The Importance of Emergency Funds in Retirement Planning
Nachrichten Ticker - www.finanzen.ch writes Gesetzesvorschlag in Arizona: Wird Bitcoin bald zur Staatsreserve?
Nachrichten Ticker - www.finanzen.ch writes So bewegen sich Bitcoin & Co. heute
Nachrichten Ticker - www.finanzen.ch writes Aktueller Marktbericht zu Bitcoin & Co.
We do not like Purchasing Power or Real Effective Exchange Rate (REER) as measurement for currencies. For us, the trade balance decides if a currency is overvalued. Only the trade balance can express productivity gains, while the REER assumes constant productivity in comparison to trade partners.
Who has read Michael Pettis, knows that a rising trade surplus may also be caused by a higher savings rate while the trade partners decided to spend more. This is partially true. Recently Europeans started to increase their savings rate, while Americans reduced it. This has led to a rising trade and current surplus for the Europeans. But also to a massive Swiss trade surplus with the United States, that lifted Switzerland on the U.S. currency manipulation watch list.
To control the trade balance against this “savings effect”, economists may look at imports. When imports are rising at the same pace as GDP or consumption, then there is no such “savings effect”.
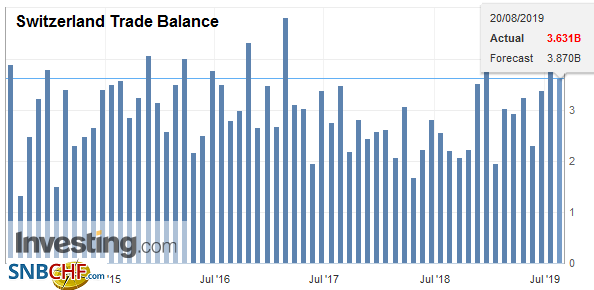
After the record trade surpluses, the Swiss economy may have turned around: consumption and imports are finally rising more than in 2015 and early 2016. In March the trade surplus got bigger again, still shy of the records in 2016.
Swiss National Bank wants to keep non-profitable sectors alive
Swiss exports are moving more and more toward higher value sectors: away from watches, jewelry and manufacturing towards chemicals and pharmaceuticals. With currency interventions, the SNB is trying to keep sectors alive, that would not survive without interventions.
At the same time, importers keep the currency gains of imported goods and return little to the consumer. This tendency is accentuated by the SNB, that makes the franc weaker.
Texts and Charts from the Swiss customs data release (translated from French).
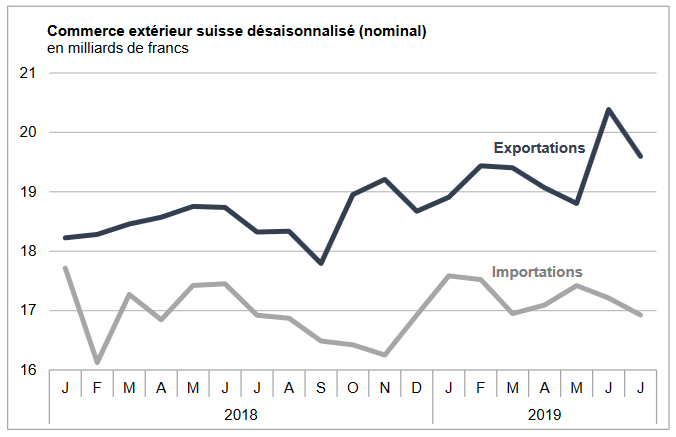
Exports and Imports YoY DevelopmentIn July 2019, seasonally adjusted exports fell by 3.9% (actual: -1.8%), following their rise from the previous month (+ 8.4%). Despite this caveat, they continue to show a clear upward trend since September 2018. Down 1.7% (real: -0.5%), imports have stagnated since the beginning of 2019. The surplus the trade balance reached 2.7 billion francs. In short: ▲ Exports: the positive trend observed since September 2018 continues ▲ Increase in exports for machinery and electronics and paper and graphic arts products ▲ Record imports from Asia ▼ ▲ Chemistry-pharma: high volatility over the last three months |
Swiss exports and imports, seasonally adjusted (in bn CHF), July 2019(see more posts on Switzerland Exports, Switzerland Imports, ) Source: newsd.admin.ch - Click to enlarge |
Overall EvolutionAfter shining the previous month, foreign trade turned red in July 2019. Despite a decline of 3.9% to 19.6 billion francs, exports had their second largest monthly result ever reached. Down 1.7%, imports were close to CHF 17 billion. The chemistry-pharma has greatly impacted both directions of the traffic. The trade balance is closing with a surplus of 2.7 billion francs. |
Switzerland Trade Balance, July 2019(see more posts on Switzerland Trade Balance, ) Source: investing.com - Click to enlarge |
ExportsExports to the US fell by half a billion francs In July 2019, the decline in exports came from the flagship sector, chemicals and pharmaceuticals. Compared to the month of June, which had been very dynamic, they saw their sales fall by 1.2 billion francs. Immunological products particularly suffered (-447 million francs). Conversely, the machinery and electronics sector is strengthened by 5.9%. This, however, shows a slightly negative trend over the last twelve months while watchmaking exports have been growing since the beginning of the year. Stimulated by the growth of the paper and graphic arts products sector (+210 million francs), the other goods group made a positive contribution to the overall result. From a geographical point of view, the overall development suffered from the contraction of exports to North America (-12.4%, USA: -544 million francs) which had again jumped 17.3% last June . Since the beginning of 2019, shipments to this region have stagnated. In Europe (-0.6%), the decline in the United Kingdom (-229 million francs) and the Netherlands contrasted with the rise in Germany (+149 million), Italy and France. Russia. Turnover grew 1.5% with Asia, where Japan and Hong Kong took center stage. |
Swiss Exports per Sector July 2019 vs. 2018(see more posts on Switzerland Exports, Switzerland Exports by Sector, ) Source: newsd.admin.ch - Click to enlarge |
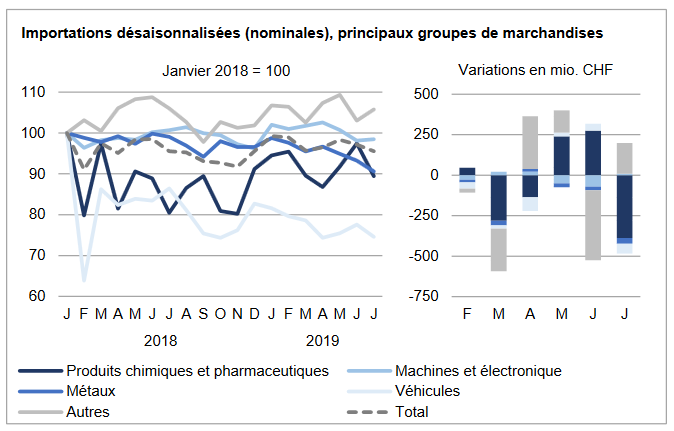
ImportsSecond consecutive decline in imports from Europe At entry also, chemistry-pharma (-388 million francs) weighed on the result. Active ingredients suffered particularly, down by a quarter (- 187 million). Imports of vehicles (-3.9%, aeronautics) and metals (-2.8%) also recorded red numbers. The machinery and electronics sector remained at its level of the previous month. Conversely, within the other goods group, the arrivals of jewelery and jewelery (gold jewelery for redesign) inflated by 154 million francs. For the latter, the highly volatile trend since January 2018 has continued. The drop in entry was almost confined to Europe (-3.9% or -480 million francs). Imports from Ireland, France and Austria were characterized by a cumulative contraction of 660 million francs (chemistry-pharma) while those of Spain were reinforced by 130 million. North America lost some feathers (-0.7%, USA). In contrast, Asian shipments soared by one-tenth, posting a record monthly level of 3.7 billion francs. The latter largely relied on gold jewelery from the United Arab Emirates (+314 million). |
Swiss Imports per Sector July 2019 vs. 2018(see more posts on Switzerland Imports, Switzerland Imports by Sector, ) Source: newsd.admin.ch - Click to enlarge |
Tags: Featured,newsletter,Switzerland Exports,Switzerland Exports by Sector,Switzerland Imports,Switzerland Imports by Sector,Switzerland Trade Balance
