According to revised figures, things were really looking up for US industry. For the month of April 2018, the Federal Reserve’s Diffusion Index (3-month) for Industrial Production hit 68.2. Like a lot of other sentiment indicators, this was the highest in so long it had to be something. For this particular index, it hadn’t seen better than 68 since way back in March 2010, back when the economy looked briefly like it might actually recover. And like March 2010, the altitude has proved entirely too short-lived. Starting in May 2018, sentiment began to creep a little lower. These indices tend to be very noisy month-to-month, but the overall directly has become pretty obvious as further months unfolded. The latest
Topics:
Jeffrey P. Snider considers the following as important: 5) Global Macro, Business cycle, China, currencies, economy, EuroDollar, Featured, Federal Reserve/Monetary Policy, industrial production, industry, manufacturing, Markets, Mining, nber, newsletter, Oil, oil prices, Recession, stocks, The United States, U.S. Industrial Production
This could be interesting, too:
Nachrichten Ticker - www.finanzen.ch writes Die Performance der Kryptowährungen in KW 9: Das hat sich bei Bitcoin, Ether & Co. getan
Nachrichten Ticker - www.finanzen.ch writes Wer verbirgt sich hinter der Ethereum-Technologie?
Martin Hartmann writes Eine Analyse nach den Lehren von Milton Friedman
Marc Chandler writes March 2025 Monthly
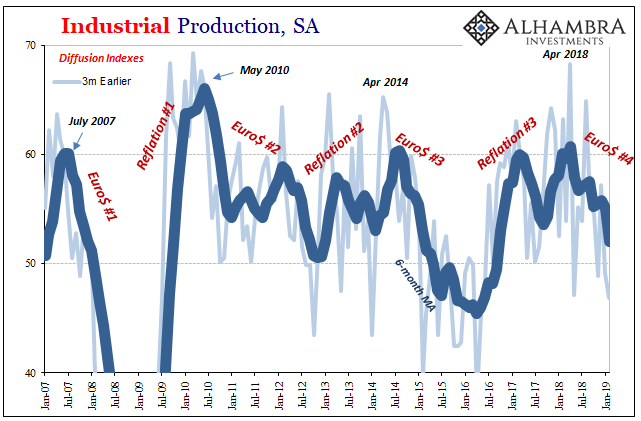
According to revised figures, things were really looking up for US industry. For the month of April 2018, the Federal Reserve’s Diffusion Index (3-month) for Industrial Production hit 68.2. Like a lot of other sentiment indicators, this was the highest in so long it had to be something. For this particular index, it hadn’t seen better than 68 since way back in March 2010, back when the economy looked briefly like it might actually recover.
| And like March 2010, the altitude has proved entirely too short-lived. Starting in May 2018, sentiment began to creep a little lower. These indices tend to be very noisy month-to-month, but the overall directly has become pretty obvious as further months unfolded. The latest monthly reading, for February 2019 (the diffusion estimates are one month further behind the rest of the IP figures), was 46.8.
That’s the lowest since May 2016. Even discounting that one monthly result, the 6-month average has dropped to 52; the lowest since September 2016. |
U.S. Industrial Production, SA 2007-2019(see more posts on U.S. Industrial Production, ) |
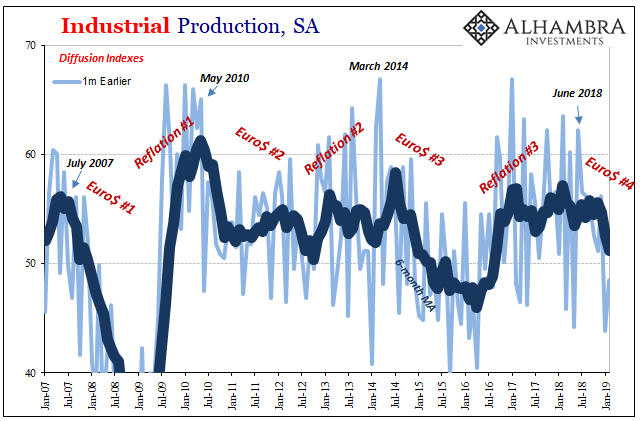
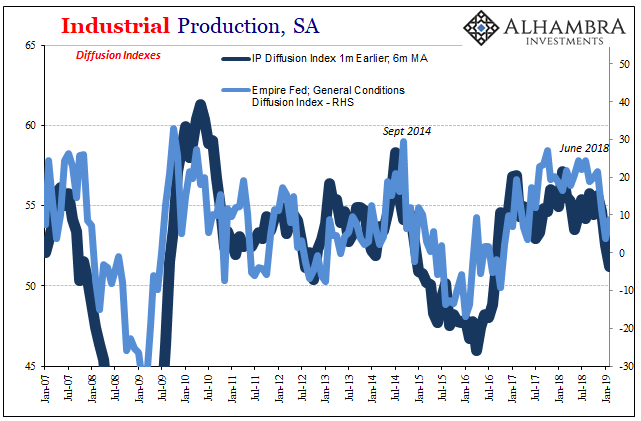
| It is pretty consistent with other measures of the same type. The 1-month US IP diffusion index topped out around June last year. That’s around the same inflection point as, for example, FRBNY’s Current General Business Conditions Index for New York (otherwise known as the Empire Fed manufacturing). |
U.S. Industrial Production, SA 2007-2019(see more posts on U.S. Industrial Production, ) |
U.S. Industrial Production, SA 2007-2019(see more posts on U.S. Industrial Production, ) |
|
| Consistent with markets, April and May (especially May 29) have proved to be something of a stopping point for whatever that was beforehand (some would call it a boom, I don’t think it ever came close). What developed over the back half of 2018 wasn’t a collapse, however, but it has been a noticeable slowdown particularly in the manufacturing sector. |
U.S. Industrial Production, SA 2016-2019(see more posts on U.S. Industrial Production, ) |
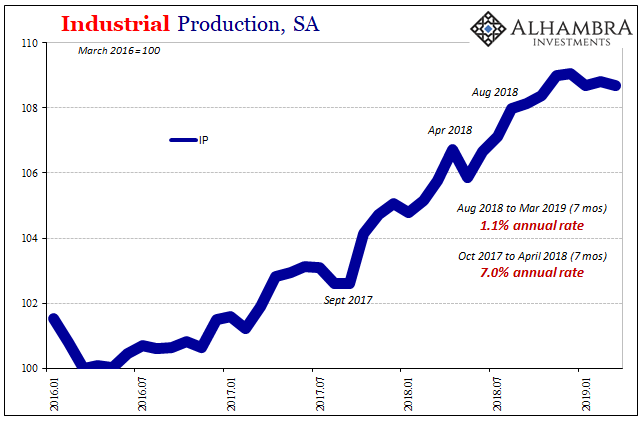
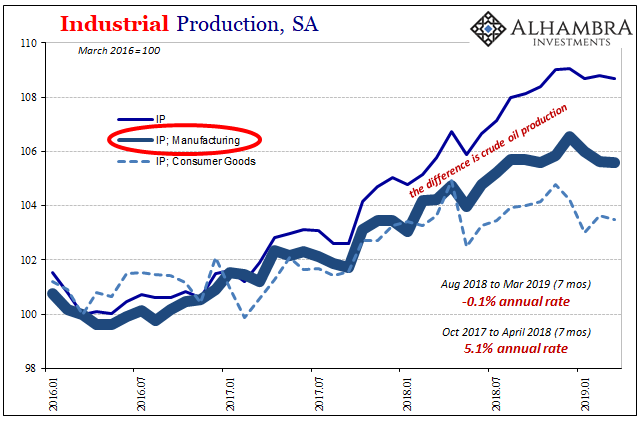
| According to revised estimates from the Fed, US Industrial Production overall going back to last August just hasn’t been the same. As sentiment began to soften in the months prior, production levels have followed from what was mounting (and then confirmed) uncertainty.
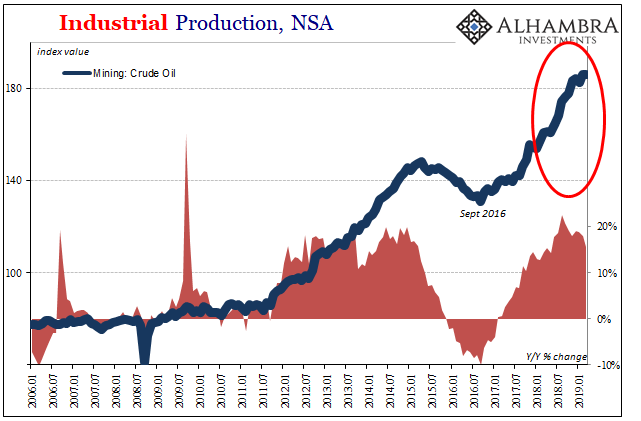
Whereas between October 2017 and April 2018, IP was rising at a 7% annual rate (hurricane boost included) going back to August it is up by only a 1.1% annual rate. And that includes a still robust energy meaning crude oil contribution. Though the rate has slowed there, too, mining for oil continues to rise at better than a 15% clip. |
U.S. Industrial Production, NSA 2006-2019 |
| That means the industrial economic pieces apart from shale oil haven’t been nearly so hot. Again, the manufacturing segment has already produced a minus sign. It isn’t a big one, yet, but going back to August 2018 the Fed figures manufacturing output was slightly less in March 2019 than it was seven months earlier.
For the production of consumer goods alone, the minus sign is a little bigger still. It brings to mind what used to be the widely-accepted concept of economic “stall speed.” In other words, when GDP for at least two quarters averaged about 2% that was when you started to worry about recession. Here’s Reuters in July 2011 summing up the growing worries underneath what was by then Euro$ #2:
As you know, 2% is now pretty much the economic average, another sign of how degraded economic function has become. Over enough time, it’s about the best that this economy has been able to manage (it’s as if there is “something” just holding it back, something that since 2008 hasn’t ever allowed sufficient momentum for the global economy to breakout). Therefore, stall speed, if there is one, might be a little lower still. |
U.S. Industrial Production, SA 2016-2019(see more posts on U.S. Industrial Production, ) |
| We’ve seen, of course, a manufacturing recession just a few years ago. Given what we see in those places today, the US economy (not “overseas turmoil”) appears to have already fallen back into that same zone where the concept of an economic stall, at least, might be a valid question.
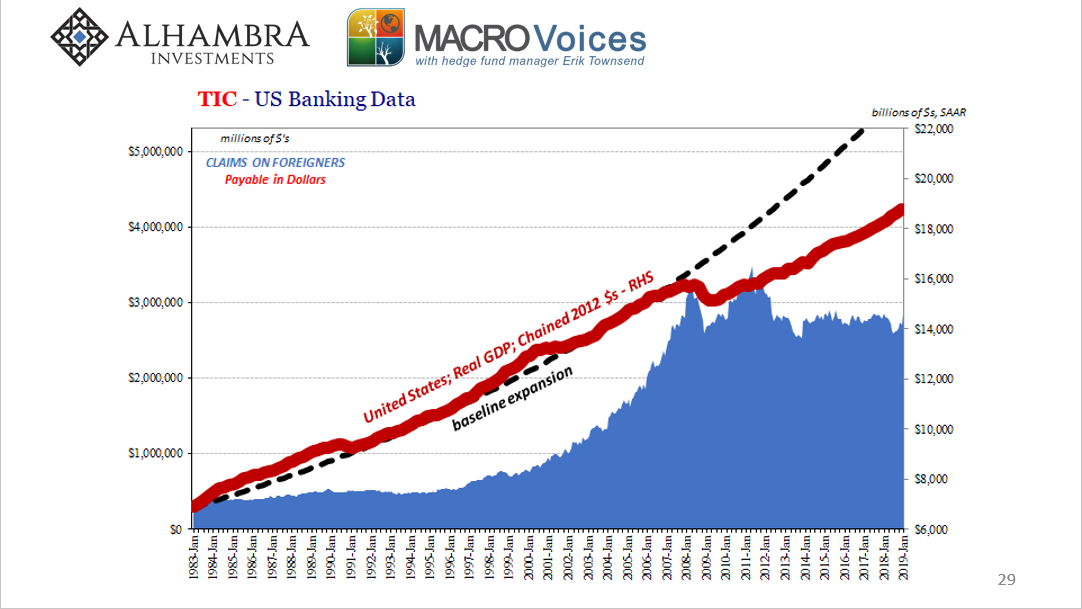
Industrial Production is one of the few indicators that the NBER uses to determine the business cycle. Though IP was negative 2015-16, the manufacturing recession, others were not (GDP came close, the BLS’s Establishment Survey only decelerated though for several years thereafter). It was a serious enough slowdown at the time, but not enough to call it a recession. Does that really matter? If the US economy does stall like in the same way it did four years ago, that pretty much kills the recovery idea (globally synchronized growth) in the same way it did…four years ago. Maybe it’s not stall speed that should concern us, more about top speed; what sure seems like a speed limit. The economy stalled out in 2007 and never got going again. |
TIC - US Banking Data, 1983-2019 |
A full-blown recession is simply a point on the downturn spectrum – a more worse case downside. In other words, a long-term “expansion” where growth to the topside is always limited but where contraction and recession to the downside are always somewhat likely is a system that is clearly malfunctioning.
In truth, people mainly care about recession (unless you’re one of the millions laid off) because of the stock market. It is about the only thing that is almost guaranteed to bring share prices crashing back to earth. That’s not nothing, of course, an important potential investment landmine to worry about.
But to ever get out of this mess, to hopefully someday validate those huge share price multiples and thus reduce the dangers of another sustained bear market (two ~60% declines already in the 21st century), it will require some high level of topline economic speed. One quarter of 4% GDP isn’t anywhere near enough. As 2014 already showed, two quarters near 5% couldn’t manage it. Sustained growth quarter after quarter at a speed where stalling isn’t even a slight probability.
Where recovery was supposed to be in 2019, more and more it looks like stall speed, whatever that may be in this economic regime, instead. Nothing changed. There was no boom, not a real one anyway (a boom is sustained meaningful growth). We aren’t breaking out of the malaise. At this point in the process, how’s that any green shoot? This is how you lose one decade and get a couple years into a second.
Tags: Business Cycle,currencies,economy,EuroDollar,Featured,Federal Reserve/Monetary Policy,industrial production,industry,manufacturing,Markets,Mining,nber,newsletter,OIL,oil prices,recession,stocks,U.S. Industrial Production

