Friday , November 15 2024
Home / SNB & CHF / Swiss Balance of Payments and International Investment Position: Q3 2019

Swiss Balance of Payments and International Investment Position: Q3 2019

Summary:
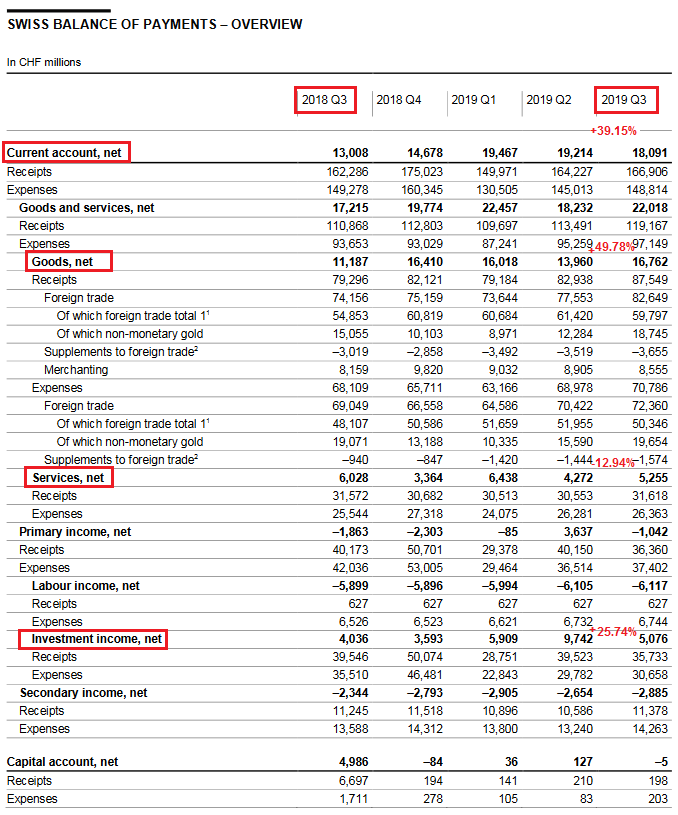
Current Account In summary: Nearly any change against the third quarter of 2018. About the same figures. But clearly and – as usual – a massive surplus. Key figures: Current Account: Up 39.15% against Q3/2018 to 18.09 bn. CHF of which Goods Trade Balance: Plus 49.78% against Q3/2018 to 16.76 bn. of which the Services Balance: Minus 12.94% to 5.25 bn. of which Investment Income: Plus 25.74% to 5.08 bn. CHF. Current Account Switzerland Q3 2019(see more posts on Switzerland Balance of Payments, Switzerland Capital Account, Switzerland Current Account, Switzerland Financial Account, ) - Click to enlarge Financial account The following is from the official press release and gives more details on the other parts of the financial account. Net acquisition of

Topics:
George Dorgan considers the following as important: , , , ,

This could be interesting, too:

Michael Njoku writes Totalitarianism Begins With A Denial of Economics

Nachrichten Ticker - www.finanzen.ch writes US-Wahl treibt Bitcoin über 90’000 US-Dollar – wie Anleger vom neuen Krypto-Hype profitieren können

Jim Fedako writes Subjectivity and Demonstrated Preference: A Possible Paradox

Connor O'Keeffe writes The Context Behind Donald Trump’s “Takeover” of the American Right

Current Account

In summary: Nearly any change against the third quarter of 2018. About the same figures. But clearly and – as usual – a massive surplus.

Key figures:

Current Account: Up 39.15% against Q3/2018 to 18.09 bn. CHF

  • of which Goods Trade Balance: Plus 49.78% against Q3/2018 to 16.76 bn.
  • of which the Services Balance: Minus 12.94% to 5.25 bn.
  • of which Investment Income: Plus 25.74% to 5.08 bn. CHF.

Current Account Switzerland Q3 2019

(see more posts on Switzerland Balance of Payments, Switzerland Capital Account, Switzerland Current Account, Switzerland Financial Account, )
Swiss Balance of Payments and International Investment Position: Q3 2019

- Click to enlarge

Financial account

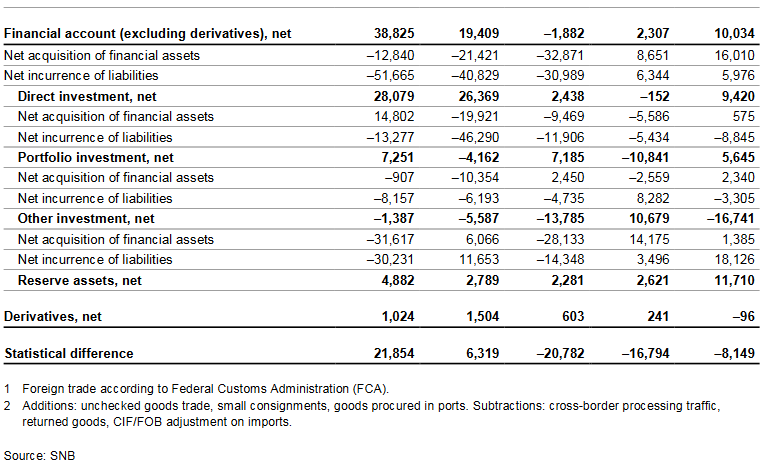
The following is from the official press release and gives more details on the other parts of the financial account.

Net acquisition of financial assets

The assets side of the financial account registered a net acquisition of CHF 16 billion (Q3 2018: net reduction of CHF 13 billion).

Reserve assets contributed CHF 12 billion to this net acquisition (Q3 2018: net acquisition of CHF 5 billion).

Other investment saw a net acquisition of CHF 1 billion (Q3 2018: net reduction of CHF 32 billion). This was the result of two contrary developments: An increase in foreign claims for most sectors was offset by a reduction in intragroup lending to non-residents by Swiss-domiciled, foreign-controlled finance companies.

Direct investment also saw a net acquisition of CHF 1 billion in the third quarter of 2019 (Q3 2018: net acquisition of CHF 15 billion). This resulted from larger transactions which had a net balancing effect: parent companies in Switzerland increased equity capital in their non-resident subsidiaries and reinvested earnings abroad, while resident companies (excluding finance companies) reduced intragroup lending to non-residents.

Portfo lio invest ment showed a net acquisit io n of CHF 2 billion (Q3 2018: net reduction of CHF 1 billion). Purchases by resident investors of equity securities of non-resident issuers exceeded sales of debt securities.

Net incurrence of liabilities

The liabilities side of the financial account registered a net incurrence of CHF 6 billion (Q3 2018: net reduction of CHF 52 billion).

Other investment posted a net incurrence of liabilities in the amount of CHF 18 billion (Q3 2018: net reduction of CHF 30 billion). Resident banks increased their liabilities towards non-resident banks (interbank market). This was offset by resident finance companies repaying loans granted by non-resident group companies.

Direct investment posted a net reduction of CHF 9 billion (Q3 2018: net reduction of CHF 13 billion). As in the previous quarters, non-resident parent companies withdrew equity capital from their resident subsidiaries, albeit on a much lower scale than before. In addition, resident subsidiaries repaid loans granted by non-resident group companies. The impact of the reduction in equity capital and loans was lessened by the fact that non-resident parent companies reinvested in Switzerland the earnings of their resident subsidiaries.

Portfolio investment registered a net reduction of CHF 3 billion (Q3 2018: net reduction of CHF 8 billion). Non-resident investors sold shares of resident issuers.

Net

The financial account showed a balance of CHF 10 billion (Q3 2018: CHF 40 billion). The balance is calculated as the sum of all net acquisitions of assets minus the sum of all net incurrences of liabilities plus the balance from derivatives transactions. The financial account balance corresponds to the change in the net investment position resulting from cross-border investment.

Financial Account, Net, Q3 2019

Swiss Balance of Payments and International Investment Position: Q3 2019

- Click to enlarge

Switzerland’s International investment position

Assets

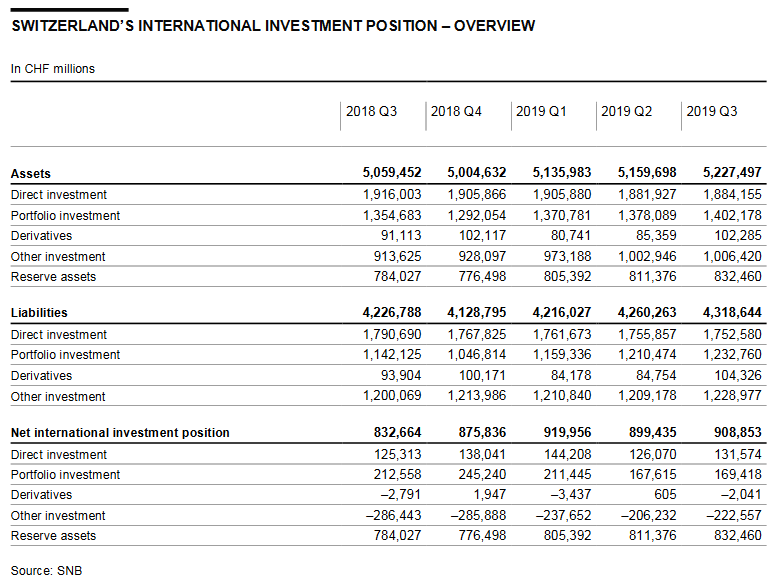
Stocks of assets rose by a total of CHF 68 billion overall to CHF 5,227 billio n co mpared with the second quarter of 2019. This increase was mainly due to valuation gains in portfolio investment and reserve assets as a result of higher prices on foreign stock exchanges. Stocks of portfolio investment were up by CHF 24 billion to CHF 1,402 billion and those of reserve assets by CHF 21 billion to CHF 832 billion. Besides valuation gains, financial account transactions were another contributor to the growth in reserve assets. Stocks of derivatives also increased markedly by CHF 17 billion to CHF 102 billion. By contrast, there were only insignificant changes in the stocks of direct investment and other investment.

Liabilities

Stocks of liabilities rose by CHF 58 billion overall to CHF 4,319 billion. Valuation gains in portfolio investment due to higher prices on the Swiss stock exchange contributed more than one-third of this increase. Stocks of portfolio investment were up by CHF 22 billion to CHF 1,233 billion. Other investment rose by CHF 20 billion to CHF 1,229 billion, primarily driven by an increase in transactions. Stocks of derivatives were also up by CHF 20 billion to CHF 104 billion. By contrast, stocks of direct investment declined by CHF 3 billion to CHF 1,753 billion due to financial account transactions.

Net international investment position

Given that stocks of assets (up CHF 68 billion) showed a more pronounced increase than stocks of liabilities (up CHF 58 billion), the net international investment position grew by almost CHF 10 billion to CHF 909 billion.

Switzerland International Investment Position, Q3 2019

(see more posts on Switzerland International Investment Position, )
Swiss Balance of Payments and International Investment Position: Q3 2019

Source: snb.ch - Click to enlarge

Download PDF


Tags: ,,
George Dorgan
George Dorgan (penname) predicted the end of the EUR/CHF peg at the CFA Society and at many occasions on SeekingAlpha.com and on this blog. Several Swiss and international financial advisors support the site. These firms aim to deliver independent advice from the often misleading mainstream of banks and asset managers. George is FinTech entrepreneur, financial author and alternative economist. He speak seven languages fluently.

Leave a Reply

Your email address will not be published. Required fields are marked *