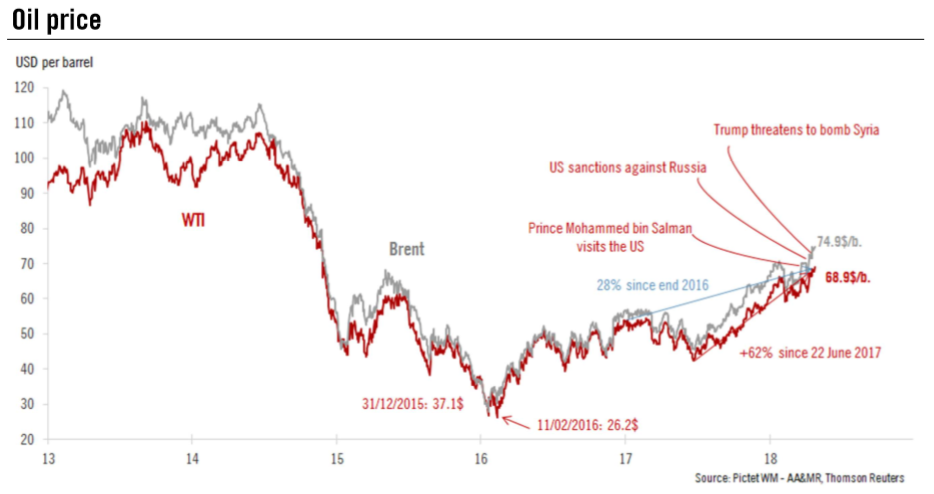
On 19 April, the price of a barrel of oil reached USD69.56 for West Texas Intermediate (WTI) and reached USD75.27 for Brent, today, the highest price since 2014. Since 9 April, oil prices have been significantly above their longterm fundamental equilibrium value. Three factors explain what has happened: Geopolitics. Between Saudi Arabia’s Prince Mohammed bin Salman visit to the US at end March, new US sanctions against Russia and western airstrikes against Syria, geopolitical developments have been to the fore in recent weeks. As a result, worries about Middle East stability have resurfaced. In particular, Iranian supply could be cut if a breakdown in the nuclear agreement leads to fresh sanctions. Financial market
Topics:
Jean-Pierre Durante considers the following as important: 5) Global Macro, Featured, Macroview, newsletter, oil price equilibrium
This could be interesting, too:
Nachrichten Ticker - www.finanzen.ch writes Die Performance der Kryptowährungen in KW 9: Das hat sich bei Bitcoin, Ether & Co. getan
Nachrichten Ticker - www.finanzen.ch writes Wer verbirgt sich hinter der Ethereum-Technologie?
Martin Hartmann writes Eine Analyse nach den Lehren von Milton Friedman
Marc Chandler writes March 2025 Monthly
On 19 April, the price of a barrel of oil reached USD69.56 for West Texas Intermediate (WTI) and reached USD75.27 for Brent, today, the highest price since 2014. Since 9 April, oil prices have been significantly above their longterm fundamental equilibrium value. Three factors explain what has happened:
|
Oil Price, 2013 - 2018 |
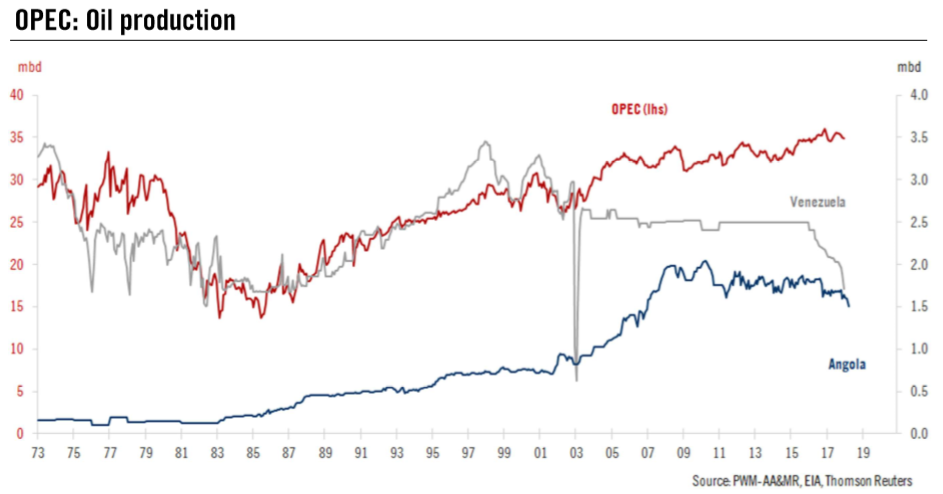
| The most dramatic example of unintentional reduction is Venezuela, where production collapsed 30% between 2015 and end 2017. |
OPEC Oil Production, 1973 - 2018 |
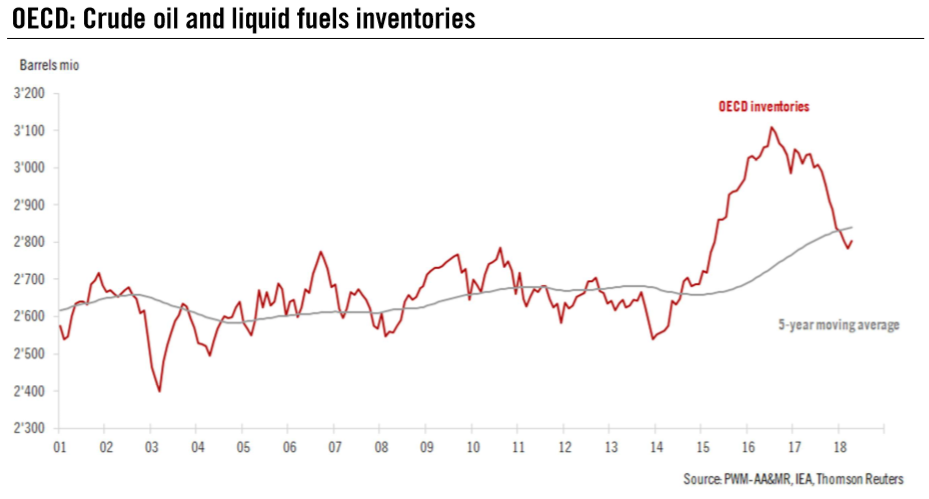
| Meanwhile, OECD oil inventories have recently fallen below their five-year moving average. Now that OPEC and Russia’s main objective has been reached, they can afford to relax discipline somewhat. Instead, discussions between OPEC and Russia about new targets and quotas are underway. They may agree a new inventory target or extend the production cuts beyond their scheduled expiry at the end of the year. The possibility of further supply restrictions is generating a price premium for oil. |
OECD Crude Oil and Liquid Fuels Inventories, 2001 - 2018 |
| However, factors that tend to favour tighter oil supply are, in our view, in large part counterbalanced by other, broader considerations.
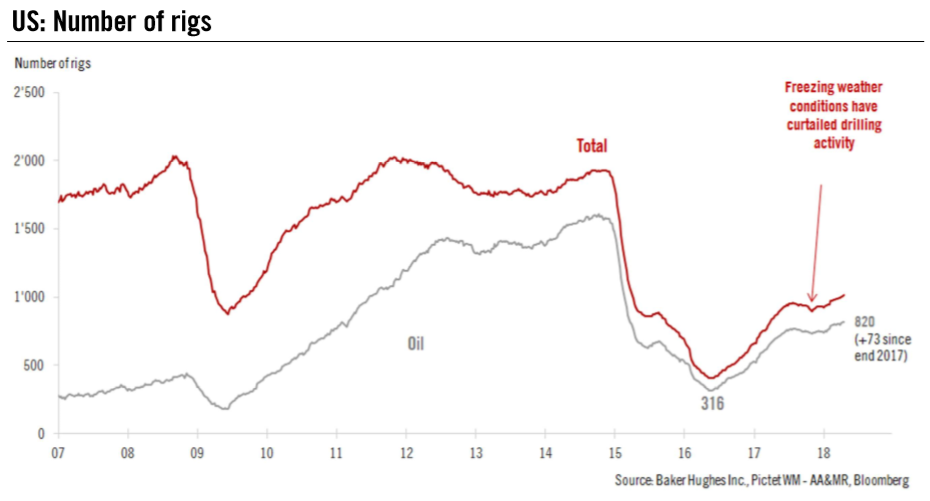
Outside OPEC, US drilling activity continues at a sustained pace (+73 rigs since end 2017). |
US Number of Rigs, 2007 - 2018 |
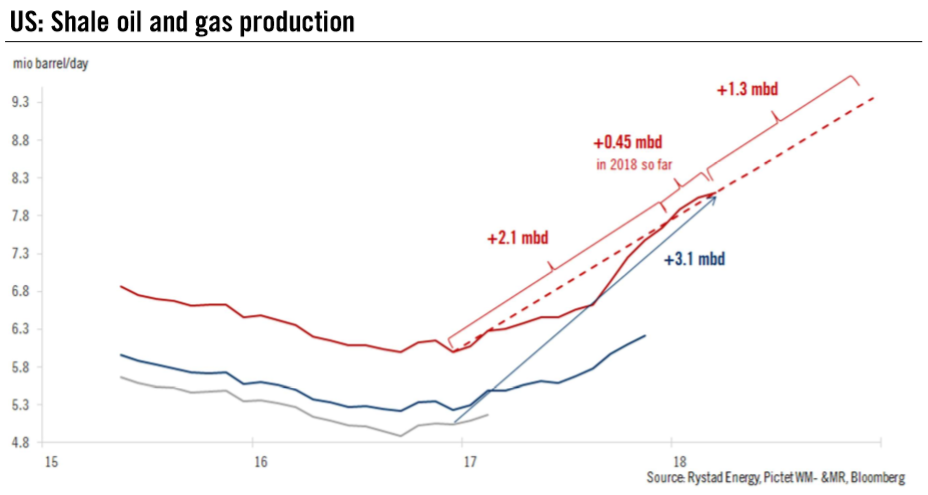
| This dynamism is translating into increasing US shale oil production, with the US set to add 1 million extra barrels per day of oil production in 2018. |
US Shale Oil and Gas Production, 2015 - 2018 |
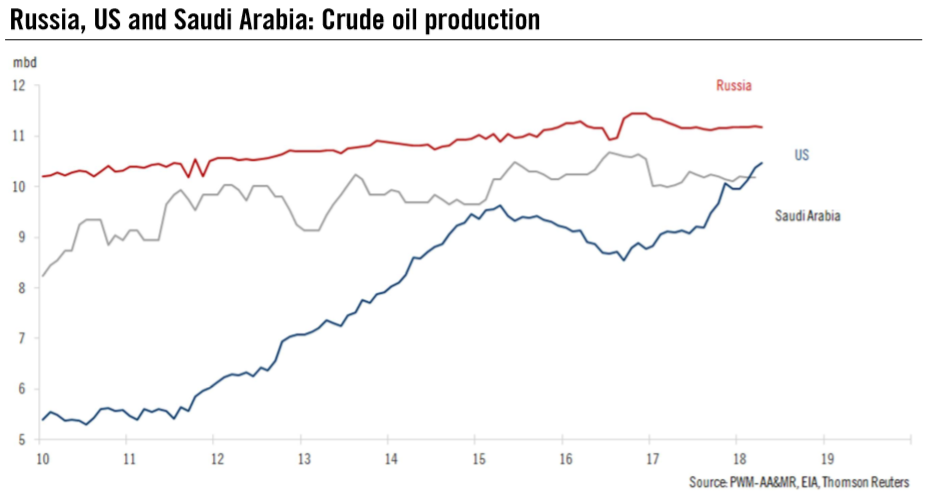
| US oil production should be well able to compensate for any OPEC + Russia cuts. |
Russia, US and Saudi Arabia Crude Oil Production, 2010 - 2018 |
| On top of these supply-side aspects, the potential for global demand appears limited – last week, the International Monetary Fund left its 3.9% world GDP growth forecast for both 2018 and 2019 unchanged. Moreover, recently leading indicators of global activity have been heading south, suggesting stabilisation rather than acceleration of world GDP growth.
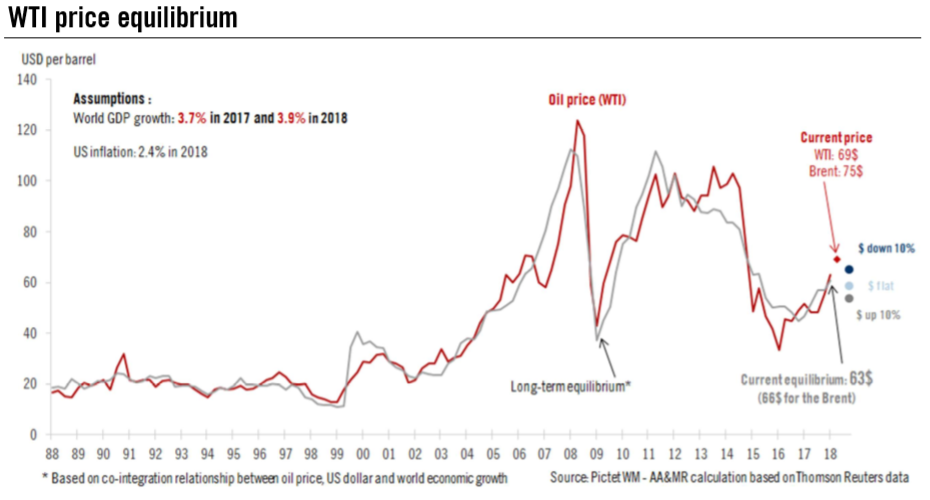
As a result, our oil price fundamental equilibrium remains unchanged (USD63 for WTI and USD66 for the Brent). This means geopolitics and technical factors currently are adding a USD6 premium. This situation could prevail for a while, in particular if OPEC members and Russia reach an agreement to extend production cuts. Beyond these factors, which could prove temporary, oil supply and demand appears relatively well balanced. At this stage, we do not see fundamental forces at work pushing prices higher. As a result we expect to see prices attracted towards their long-term fundamental equilibrium levels on a three- to six-month horizon. |
WTI Price Equilibrium, 1988 - 2018 |
Tags: Featured,Macroview,newsletter,oil price equilibrium

