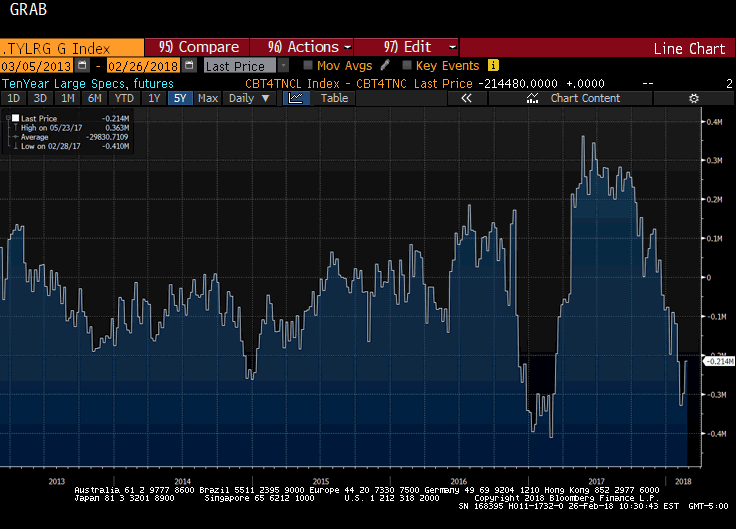
This Great Graphic from Bloomberg shows the net large speculative positioning in the 10-year note futures over the past five years. They began last year with a huge next short position of more than 400k contracts. By May-June, the speculators had reversed themselves and were net long over 350k contracts. In the middle of December 2017, the net position was short again and peaked in early February near 327.5k contracts. Over the past two weeks, the net speculative short position has been reduced by 133k contracts. We must go below the net position to the gross positioning to understand what has happened. After all, the net position is the sum of the gross long and gross short positions. Buying to cover shorts is
Topics:
Marc Chandler considers the following as important: Commitment of Traders, Featured, FX Trends, Great Graphic, newslettersent, TLT
This could be interesting, too:
Nachrichten Ticker - www.finanzen.ch writes Die Performance der Kryptowährungen in KW 9: Das hat sich bei Bitcoin, Ether & Co. getan
Nachrichten Ticker - www.finanzen.ch writes Wer verbirgt sich hinter der Ethereum-Technologie?
Marc Chandler writes March 2025 Monthly
Mark Thornton writes Is Amazon a Union-Busting Leviathan?
| This Great Graphic from Bloomberg shows the net large speculative positioning in the 10-year note futures over the past five years. They began last year with a huge next short position of more than 400k contracts.
By May-June, the speculators had reversed themselves and were net long over 350k contracts. In the middle of December 2017, the net position was short again and peaked in early February near 327.5k contracts. Over the past two weeks, the net speculative short position has been reduced by 133k contracts. We must go below the net position to the gross positioning to understand what has happened. After all, the net position is the sum of the gross long and gross short positions. Buying to cover shorts is different than buying to go long. And that is what has happened. The gross speculative short position peaked in the middle of February at roughly 955.6k contracts. It fell 59.6k contracts in the latest reporting week, which ended February 20. So, in the two weeks, that the net short position fell by 133 k contracts, the gross short position has fallen by about 43k contracts. Over the past two weeks, the gross long position has increased by nearly 70k contracts and by more than 120k contracts since early January. Bottom pickers are emerging faster than the shorts are covering. We suggested that the near-term technical outlook for the 10-year note futures is constructive. The March contract has built a base near 120-00. Initial resistance seen near 121-00 was tested today. The 20-day moving average there as well (120-30) and there has not been a close above it since the middle of December. The technical indicators are supportive and there looks to be near-term potential toward 122-00. |
Net TSy |
Tags: $TLT,Commitment of Traders,Featured,Great Graphic,newslettersent

