US equities and the dollar appear to be moving higher together. The greenback is near its best level this year against most of the major and emerging market currencies. The Chinese yuan is not an exception to this generalization. At the same time, the S&P 500 is at its best levels since the downdraft February, and the NASDAQ set a new record high earlier in the week. Many investors and observers speculate about the relationship between the dollar and equities. To explore the issue, we have to define the terms and know what we are measuring. It is difficult to think about it in the abstract. How should we measure the dollar? One popular approach is to use the Dollar Index. However, it is not a trade-weighted basket.
Topics:
Marc Chandler considers the following as important: 4) FX Trends, EUR, Featured, JPY, newsletter, SPY, USD
This could be interesting, too:
Nachrichten Ticker - www.finanzen.ch writes Die Performance der Kryptowährungen in KW 9: Das hat sich bei Bitcoin, Ether & Co. getan
Nachrichten Ticker - www.finanzen.ch writes Wer verbirgt sich hinter der Ethereum-Technologie?
Martin Hartmann writes Eine Analyse nach den Lehren von Milton Friedman
Marc Chandler writes March 2025 Monthly
US equities and the dollar appear to be moving higher together. The greenback is near its best level this year against most of the major and emerging market currencies. The Chinese yuan is not an exception to this generalization. At the same time, the S&P 500 is at its best levels since the downdraft February, and the NASDAQ set a new record high earlier in the week.
Many investors and observers speculate about the relationship between the dollar and equities. To explore the issue, we have to define the terms and know what we are measuring. It is difficult to think about it in the abstract. How should we measure the dollar? One popular approach is to use the Dollar Index. However, it is not a trade-weighted basket. Two of the US largest partners, China and Mexico, are not included. The euro and currencies that gravitate in the euro’s orbit, like the Swiss franc and Swedish krona. The yen gets a 13.6% weighting, and the Canadian dollar and that is the extent of the inclusion of non-European currencies.
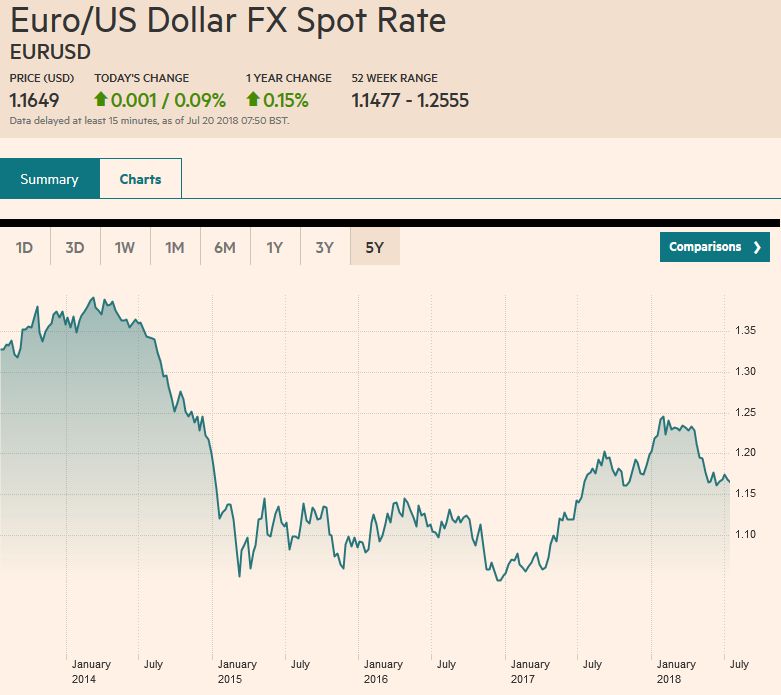
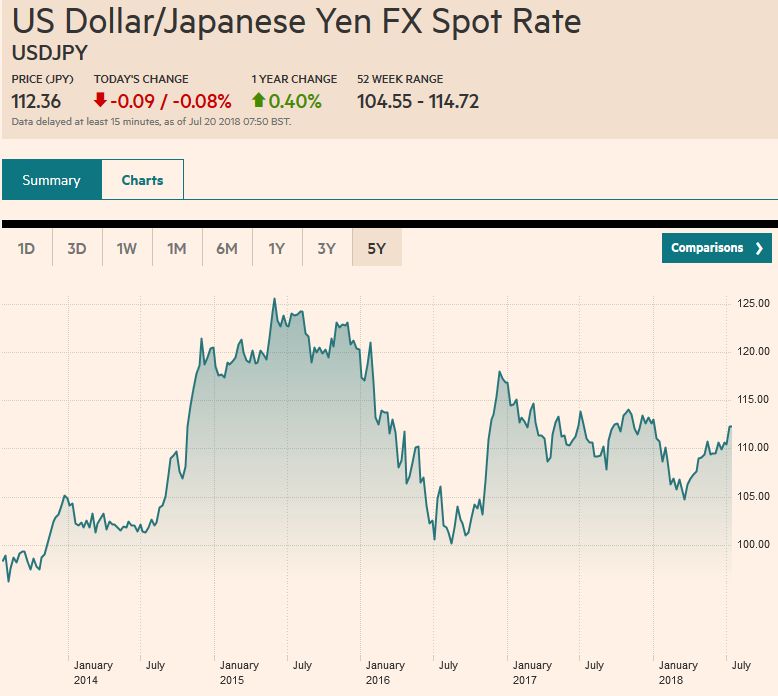
For the purpose of this exercise, let’s look at the euro-dollar and dollar-yen exchange rates. And let’s look at both the S&P 500 and a local benchmark, like the Dow Jones Stoxx 600 and the Topix. We want to look at the correlation in two ways. The first is the value of the two time-series (exchange rate and equity market) and the second is on the percentage change of each. The latter is important when considering hedging. We look at a rolling 60-day period.
| We turn to the euro first. On a pure value basis, the euro and the S&P 500 are inversely correlated (-0.56). They had been positively correlated from mid-December through mid-May. The correlation peaked in late January above 0.90 and bottomed in mid-June near -0.75.
On a percentage change basis, the euro and the S&P 500 are positively correlated by almost 0.2. This is not particularly statistically significant, but it is the strongest since late April. The peak was in February, a little above 0.3. It had been inverse from the middle of 2017 through early February, bottoming last November near -0.35. Taking a step back, we note that the correlation of returns was positive from October 2008 and peaked in late 2011, above 0.8. The correlation gradually trended lower, and except for a brief period in 2015 when it jumped above 0.50 and again in 2017, it stayed below 0.2. The correlation has spent more time inverse, and it bottomed around -0.60 in August 2015. The euro-dollar exchange rate often moves in the opposite direction of the Dow Jones Stoxx 600. This year there have been two brief periods of a positive correlation between the levels of the two series. The first was in late January through mid-February, peaked near 0.78. The other was a two-week period in Apri and peaked around 0.34. The third period of positive correlation began last week and is now just below 0.34. This year’s correlation range largely duplicates last years which was the largest since 2014. |
EUR/USD, Jan 2014 - Jul 2018(see more posts on EUR/USD, ) Source: markets.ft.com - Click to enlarge |
The returns, which is to say the percentage change, of the euro and the Dow Jones Stoxx 600 is also typically inverse. Since May 2013, there have been only two brief periods of positive correlation. For most of Q3 16, the correlation was positive and reached almost 0.60. Last year, from May and into July, the correlation also turned positive, to approached 0.25. The correlation stands slightly below zero presently.
The dollar tends to move in the same direction against the yen as the S&P 500 moves. Currently, the correlation between the two is 0.68, which is a little below the high for the year see in mid-June around 0.72. There has been a period in each of the past five years, the correlation nears 1.0. There are also periods every year that the correlation inverts. In fact, for most of Q1, the correlation was inverse. In fact, the -0.70 correlation in early February was the most inverted since 2010.
On a percent change basis, the correlation is considerably more stable. It is not bee inverted since late 2016. There was also a brief period of inversion in April-June 2015. That was the first inversion since early 2012. Presently, the correlation is near 0.24. Over the past couple of year, it has largely remained below 0.60, though back in 2014 and 2015 there were periods in which the correlation approached 0.80.
| The dollar-yen rate and the Topix typically move in the same direction. The distribution of the correlation over the five years is heavily weighted the 0.8-0.95 range. The correlation rarely inverts. There were short periods in 2014 and 2015 of inversion. The inversion at the start of this year (-0.50) was the largest since 2011. The 60-day rolling correlation has moved back into negative territory last week and now stands at -0.31.
On a percentage change basis, the returns are more correlated but less statistically significant. Since the Great Financial Crisis, the correlation became inverse a few times, but only barely and for a short period of time. The correlation is about 0.17 presently. |
USD/JPY, Jan 2014 - Jul 2018(see more posts on usd-jpy, ) Source: markets.ft.com - Click to enlarge |
There had been some suggestion trying to link foreign buyers of US stocks to explain the positive correlation of the dollar. However, this seems like a stretch. The TIC data, which was released this week covered the month of May. Foreign investors sold $25.5 bln of US equities, and the S&P 500 rallied almost 2.2%.
As it turns out there is a strong correlation between the number of churches in a city and the number of mortuaries. However, what is really happening, is that the two are correlated to a thirdsfactor: population size. Perhaps this is a helpful way to think about what is happening between the dollar-yen and euro-dollar exchange rates and equities. The same force that is helping drive the dollar higher makes US equities attractive.
Strong growth and a supportive policy mix. As we noted earlier this week, despite the Fed’s seven rate hikes and the deluge of supply, the real yield of the three-month T-bill is still negative. The Fed funds target is negative. In the past, it has often required a negative real Fed funds rate to foster an economic recovery from recession. Through the first five months of the year, foreign investors were net buyers of about $12 bln of US equities. The biggest buyers of US equities continue to be US corporations who are on pace to make record buybacks this year.
Given the nominal interest rate differential, dollar-based investors are paid to hedge the currency risk assumed when buying European and Japanese shares. The cost of the hedge is essentially the interest rate differential over the period of the hedge. However, the opposite is true for euro and yen-based investors. The cost of hedging the dollar is expensive as the cost of borrowing dollars to sell is as expensive as it has been.
Tags: #USD,$EUR,$JPY,Featured,newsletter,SPY
