In late August 2006, ABC News asked more than a dozen prominent economists to evaluate the impacts of hurricane Katrina on the US economy. The cataclysmic storm made landfall on August 29, 2005, devastating the city of New Orleans and the surrounding Gulf coast. The cost in human terms was unthinkable, and many were concerned, as people always are, that in economic terms the country might end up in similar devastation. One year later, however, though New Orleans itself was far from back to normal, the economy hadn’t been noticeably dented. GDP, as one measure, was 3.34% in Q3 2005 (according to the latest estimates), the quarter in which the maelstrom struck. That was at the average growth rate for the preceding
Topics:
Jeffrey P. Snider considers the following as important: Auto Production, Auto Sales, consumer goods, currencies, economy, Featured, Federal Reserve/Monetary Policy, harvey, industrial production, irma, katrina, manufacturing, Markets, Mining, Motor Vehicle Assemblies, motor vehicle sales, newsletter, Retail sales, The United States, U.S. Industrial Production, U.S. Motor Vehicle Assemblies, U.S. Retail Sales
This could be interesting, too:
Nachrichten Ticker - www.finanzen.ch writes Die Performance der Kryptowährungen in KW 9: Das hat sich bei Bitcoin, Ether & Co. getan
Nachrichten Ticker - www.finanzen.ch writes Wer verbirgt sich hinter der Ethereum-Technologie?
Martin Hartmann writes Eine Analyse nach den Lehren von Milton Friedman
Marc Chandler writes March 2025 Monthly
In late August 2006, ABC News asked more than a dozen prominent economists to evaluate the impacts of hurricane Katrina on the US economy. The cataclysmic storm made landfall on August 29, 2005, devastating the city of New Orleans and the surrounding Gulf coast. The cost in human terms was unthinkable, and many were concerned, as people always are, that in economic terms the country might end up in similar devastation.
One year later, however, though New Orleans itself was far from back to normal, the economy hadn’t been noticeably dented. GDP, as one measure, was 3.34% in Q3 2005 (according to the latest estimates), the quarter in which the maelstrom struck. That was at the average growth rate for the preceding year. The quarter after, Q4 2005, real GDP growth was held back only slightly to 2.28%.
Whether or not that was due to Katrina has never been settled. That was actually a better quarter in terms of real GDP expansion than in Q2 2005, so it may have simply been natural quarterly variation. Of course, GDP surged in Q1 2006 (+4.78%) with many economists believing that of the power of broken windows. Combined, Q4 2005 plus Q1 2006, real GDP had advanced by 3.60% (annual rate), meaning that despite Katrina the economy was still moving right at, or even slightly above, its average.
That was the message sent by those ABC surveyed in 2006. Economist Joel Naroff:
New Orleans’ impact on the U.S. economy was limited to energy and port activities, and the rest was easily replaced. And that may be the lesson. You can lose a city and not have any major impact on the economy over time. Many activities will be replaced in other parts of the country.
Hurricanes have been hitting the US ever since there was a US, just like earthquakes, blizzards, and all the nasty catalog of regular Mother Nature. We may fret about their potential devastation in economic terms, but throughout history there aren’t any economics textbooks with a chapter or two devoted to storm aftermath management.
We don’t notice them in the economy because a growing economy can easily absorb the nastiest and most brutal natural punch. The infatuation over such things like snow, cold, and Harvey is a factor of (persistently) weak economic growth. The Polar Vortex of Winter 2014 lingers in imaginations not because it was so cold or that it did all that much economic damage, but because the economy was itself so weak that we couldn’t be helped from noticing it.
It is much the same process as we find in seasonal liquidity for the very same reasons; there are always seasonal bottlenecks in terms of dollar flow or capacity availability, but in normal times, truly normal and not the current situation that is always described that way, we never notice. When liquidity is strained, as has become normal, we can only notice the seasonality, not that it is the problem so much as a natural low point it has the effect of illuminating or revealing what is.
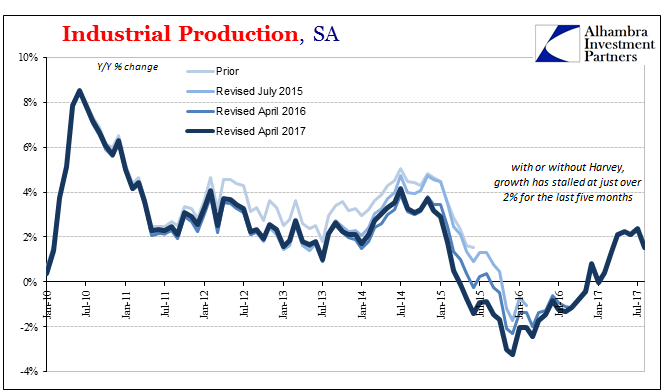
Hurricane Harvey like Katrina struck the Gulf in late August this time around Houston. The Federal Reserve published its Industrial Production statistics today figuring already a negative impact from it. Month-over-month (SA) IP was down sharply in the latest reading, nearly 1%. It had risen in each of the six prior months, therefore the narrative is already set that the setback was due to the storm.
| The Fed has even calculated what they believe is the hurricane’s subtraction. Of that 0.90% monthly decline, they estimate 0.75% was due to Harvey. |
US Industrial Production, Jan 2010 - Jul 2017(see more posts on U.S. Industrial Production, ) |
| Even if that was true, year-over-year IP would have been up by 2.3%, instead of 1.5%, which is still in the same lackluster state as the last six months (IP, revised, rose 2.4% in July Y/Y). Hurricane or not, there is no growth indicated here. |
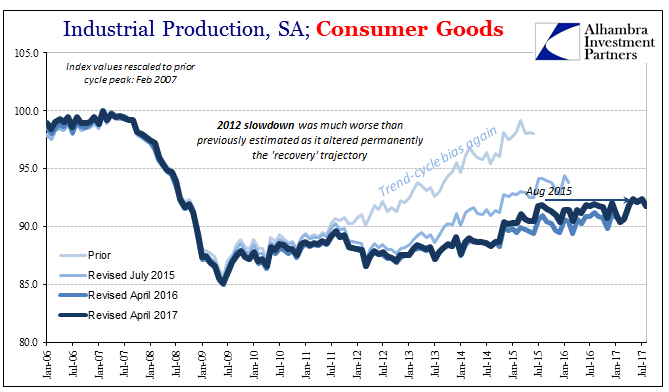
US Industrial Production, Jan 2006 - Jul 2017(see more posts on U.S. Industrial Production, ) |
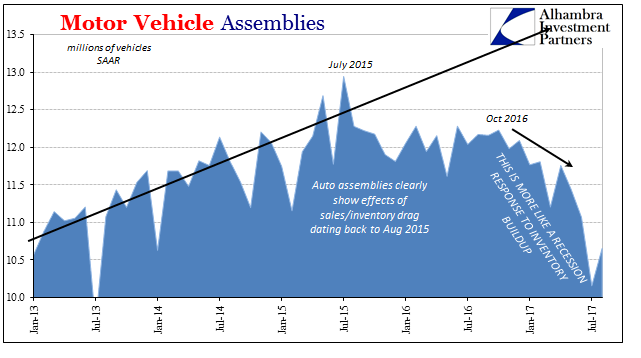
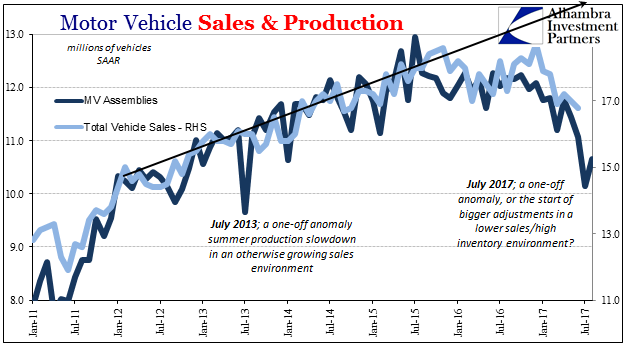
| The real economic problem, the drag behind these numbers, is the auto sector. The IP statistics last month revealed a sharp summer shutdown regime this year unlike any since 2013. In that earlier period, the scaling back of production (related to model year change-out) was an anomaly in an otherwise rapidly growing sector. |
US Motor Vehicle Assemblies, Jan 2013 - Jul 2017(see more posts on U.S. Motor Vehicle Assemblies, ) |
| In 2017, by contrast, the updated figures for August suggest that these more dramatic and deeper production cuts have lingered at least for a second month. At 10.15 million (SAAR) in July, Motor Vehicle Assemblies rebounded only slightly to a still very low 10.65 million in August. This is the US economy’s primary cyclical concern right now. |
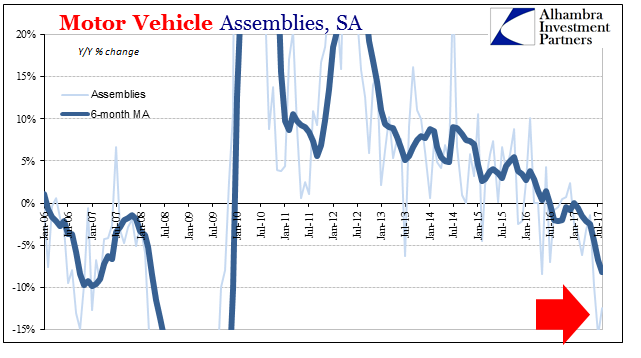
US Motor Vehicle Assemblies, Jan 2006 - Jul 2017(see more posts on U.S. Motor Vehicle Assemblies, ) |
| It’s the second straight month where domestic production volume is down more than 10% from the same month a year earlier. The only mystery surrounding these cuts is what took so long for them to materialize. As noted earlier today with regard to retail sales, auto sales have remained low despite some hope that last year’s rebound from the trough would extend, perhaps even quicken to the upside. |
US Motor Vehicle Sales & Production, Jan 2011 - Jul 2017(see more posts on motor vehicle sales, ) |
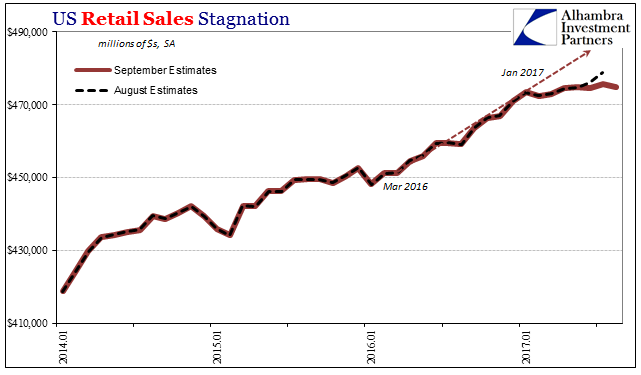
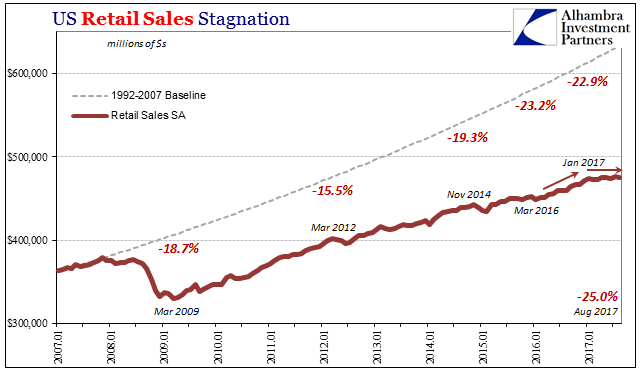
| It’s more than just weak auto sales that plague parts of the economy, as those retail sales numbers showed. The whole system in 2017 is in worse shape than was ever feared at this year’s beginning. |
US Retail Sales, Jan 2014 - 2017(see more posts on U.S. Retail Sales, ) |
| Rather than seeing a material and meaningful advance, what has become clear in everything from IP to imports is that the improvement in the second half of 2016 was it; and it wasn’t all that much to begin with. |
US Retail Sales, Jan 2007 - 2017(see more posts on U.S. Retail Sales, ) |
It is that part which will surely get lost in the Harvey and now Irma stories. The thing is that there is always some weather or natural event economic weakness can be attributed to. But only when the economy is really down does it stick. It’s easier (especially for Economists in 2017) to believe in the power of Mother Nature than the lack of power in all the world’s “stimulus.”
Tags: Auto Production,Auto Sales,consumer goods,currencies,economy,Featured,Federal Reserve/Monetary Policy,harvey,industrial production,irma,katrina,manufacturing,Markets,Mining,Motor Vehicle Assemblies,motor vehicle sales,newsletter,Retail sales,U.S. Industrial Production,U.S. Motor Vehicle Assemblies,U.S. Retail Sales

