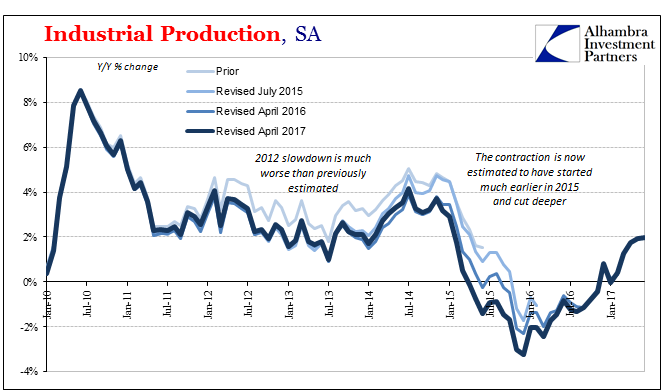
Completing a busy day of US economic data, Industrial Production was, like retail sales and inflation data, highly disappointing. Prior months were revised slightly lower, leaving IP year-over-year up just 2% in June 2017 (estimates for May were initially 2.2%). Revisions included, the annual growth rate has been stuck around 2% now for three months in a row, suggesting like those other accounts a pause or even possible end to the mini-improvement cycle. U.S. Industrial Production, YoY 2015 - 2017(see more posts on U.S. Industrial Production, ) - Click to enlarge The trajectory for US industry on the plus side now continues to undershoot both the 2002-03 as well as the 1992-93 “jobless recoveries.” In that
Topics:
Jeffrey P. Snider considers the following as important: Auto Production, Business cycle, capacity utilization, consumer spending, currencies, economy, Featured, Federal Reserve/Monetary Policy, industrial production, manufacturing, Markets, Motor Vehicle Assemblies, newsletter, The United States, U.S. Capacity Utilization, U.S. Industrial Production, U.S. Motor Vehicle Assemblies, U.S. Retail Sales
This could be interesting, too:
Nachrichten Ticker - www.finanzen.ch writes Die Performance der Kryptowährungen in KW 9: Das hat sich bei Bitcoin, Ether & Co. getan
Nachrichten Ticker - www.finanzen.ch writes Wer verbirgt sich hinter der Ethereum-Technologie?
Martin Hartmann writes Eine Analyse nach den Lehren von Milton Friedman
Marc Chandler writes March 2025 Monthly
| Completing a busy day of US economic data, Industrial Production was, like retail sales and inflation data, highly disappointing. Prior months were revised slightly lower, leaving IP year-over-year up just 2% in June 2017 (estimates for May were initially 2.2%). Revisions included, the annual growth rate has been stuck around 2% now for three months in a row, suggesting like those other accounts a pause or even possible end to the mini-improvement cycle. |
U.S. Industrial Production, YoY 2015 - 2017(see more posts on U.S. Industrial Production, ) |
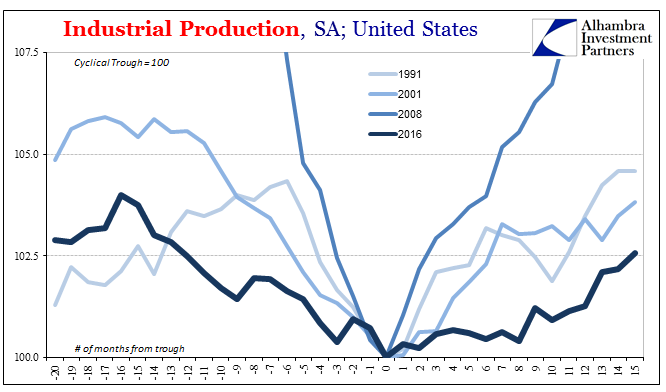
| The trajectory for US industry on the plus side now continues to undershoot both the 2002-03 as well as the 1992-93 “jobless recoveries.” In that respect, Industrial Production has yet to reach 2014 comparisons; average growth in 2014 was a small 3.5% at the highest average that year, whereas in 2017 the 6-month average is but 1.2%. |
U.S. Industrial Production, YoY 1991 - 2016(see more posts on U.S. Industrial Production, ) |
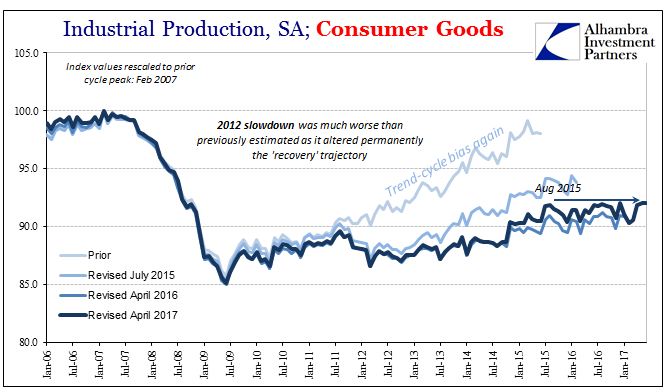
| Production of consumer goods has been largely flat and sideways going back to the eventful summer of 2015. Despite an overall economic shift toward positive growth again, US manufacturers haven’t been given any boost in the consumer segment – even though production levels here are still 8% below the peak in 2007 a decade ago. |
U.S. Industrial Production and Consumer Goods, YoY 2006 - 2017(see more posts on consumer goods, U.S. Industrial Production, ) |
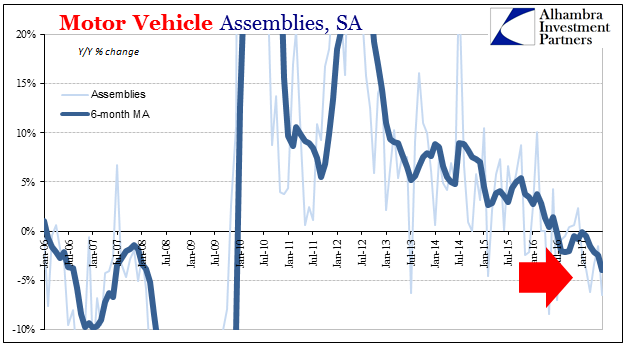
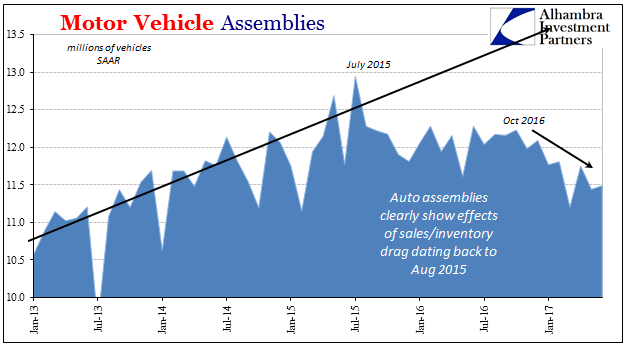
| The primary reason for downside weakness continues to be domestic auto production. For the sixth consecutive month, motor vehicle assemblies were estimated to have been less than 12 million (SAAR). That is about equal in production runs to 2014, meaning well behind the growth pace of that year. |
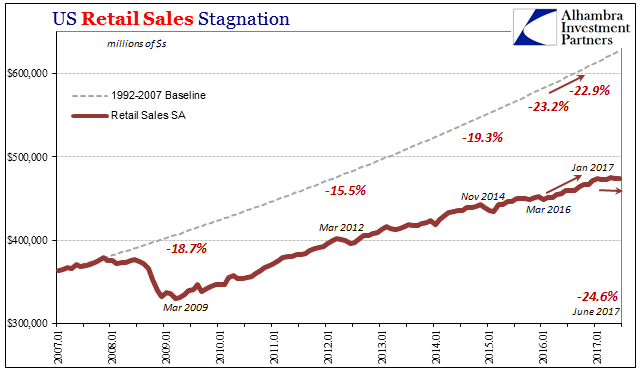
U.S. Retail Sales, YoY 2007 - 2017(see more posts on U.S. Retail Sales, ) |
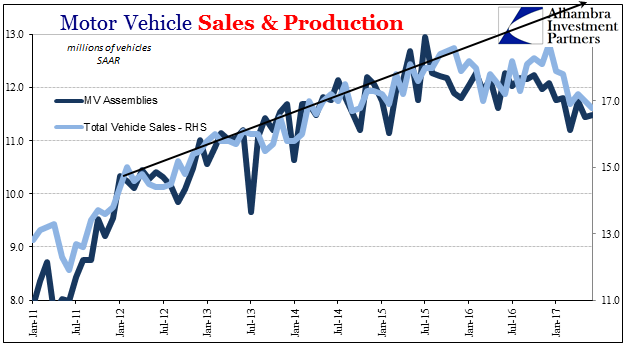
| Auto production is right now merely keeping up with lower sales. Unless consumers start buying up what has been piled up in inventory, at some point in the near future carmakers are going to have to make deeper cuts. At the moment, they are going at record incentive rates just to keep sales from falling further, cutting into profits as a short-term solution. |
U.S. Industrial Production, Motor Vehicle Assemblies, 2006 - 2017(see more posts on Motor Vehicle Assemblies, U.S. Industrial Production, ) |
| In June, total assemblies were only slightly more than in May (11.49mm vs. 11.44mm), both months among the lowest going back to 2014. If such a low factory run rate is still contributing to inventory, especially dealer stock, then it seems very possible the seasonal summer production slowdown could turn more serious (though to what degree depends on a number of factors). With retail sales confirming little growth on the consumer side, how much longer will auto manufacturers continue to offer record incentives for slightly negative sales? |
U.S. Motor Vehicle Assemblies, 2013 - 2017(see more posts on Motor Vehicle Assemblies, ) |
| The issue may turn on liquidity and financial conditions, which at the moment are more favorable than they were a year ago (“rate hikes” just don’t matter). Inventory has to be financed, and in a normal cycle deteriorating inventory ratios lead to a pullback in flexible finance (including on the consumer side) that eventually triggers inventory liquidation and the drastic, recessionary production cuts. Given these auto imbalances, re-emergence of the “rising dollar” or whatever the next one will be could be even more serious, for more than just autos, at the next downturn (which sounds preposterous given that we just got out of one; the 2012 slowdown, however, lasted into early and even middle 2013, meaning that the 2014 upturn was itself only a year long, a year and a half at most). |
U.S. Motor Vehicle Sales and Production, 2011 - 2017 |
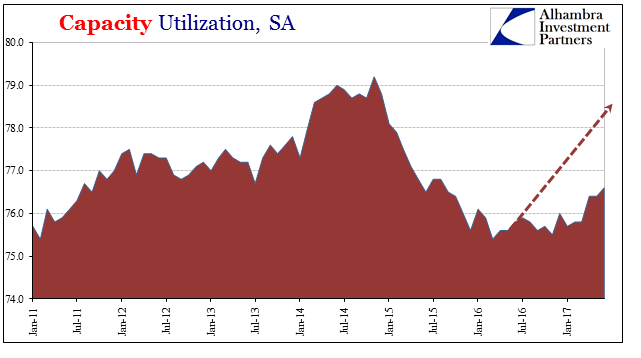
| Capacity Utilization was 76.6% in June, up from a downwardly revised 76.4% in May. Industrial efficiency continues to lag even the small overall improvement in general IP. The estimated utilization rate is still several percentage points below the peak in 2014, which was already less than the low cyclical peak in 2007.
Even with a small increase in the past few months, capacity utilization is equal to about mid-2011. That puts especially manufacturers in a difficult bind as sales don’t progress anywhere close to normal, let alone with symmetry after two years of a serious downturn. |
U.S. Capacity Utilization, 2011 - 2017(see more posts on U.S. Capacity Utilization, ) |
In other words, there is no momentum anywhere in US industry and really no reason to expect it. The most charitable that might be said of this crucial economic sector is that it isn’t operating like 2016. But 2017 isn’t proving to be all the different, either.
Tags: Auto Production,Business Cycle,capacity utilization,consumer spending,currencies,economy,Featured,Federal Reserve/Monetary Policy,industrial production,manufacturing,Markets,Motor Vehicle Assemblies,newsletter,U.S. Capacity Utilization,U.S. Industrial Production,U.S. Motor Vehicle Assemblies,U.S. Retail Sales

