Summary The euro is breaking out to the upside. The measuring objective is near .2150, which is near the 50% retracement of the euro’s drop from the mid-2014 high. Key caveat: It is about the upper Bollinger Band and rate differentials make it the most expensive to hold since the late 1990s. The head and shoulders pattern in technical analysis is most commonly seen as a reversal pattern. As this Great Graphic (created on Bloomberg) illustrates, the price action appears to have traced out such a pattern and today’s advance break the neckline. It is not ideal. It is not coming at the end of a large downmove, though the euro has pulled back from the two-year high set in September. Also, the measuring
Topics:
Marc Chandler considers the following as important: EUR, Featured, FX Trends, Great Graphic, newsletter, USD
This could be interesting, too:
Nachrichten Ticker - www.finanzen.ch writes Die Performance der Kryptowährungen in KW 9: Das hat sich bei Bitcoin, Ether & Co. getan
Nachrichten Ticker - www.finanzen.ch writes Wer verbirgt sich hinter der Ethereum-Technologie?
Martin Hartmann writes Eine Analyse nach den Lehren von Milton Friedman
Marc Chandler writes March 2025 Monthly
Summary
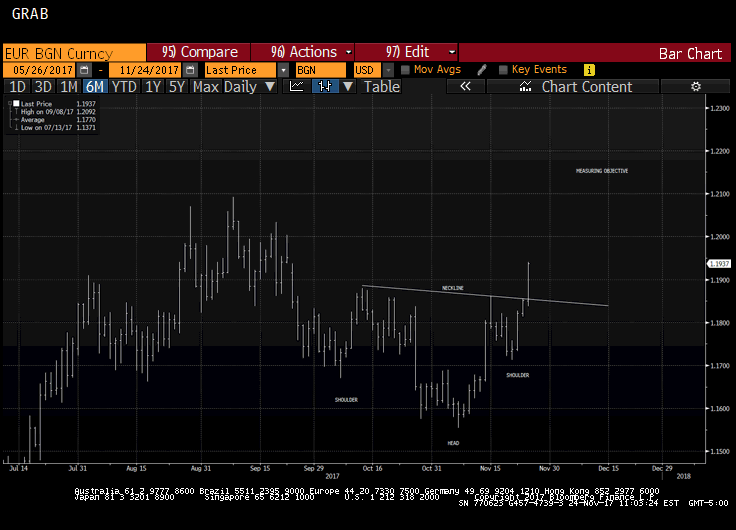
The euro is breaking out to the upside.
The measuring objective is near $1.2150, which is near the 50% retracement of the euro’s drop from the mid-2014 high.
Key caveat: It is about the upper Bollinger Band and rate differentials make it the most expensive to hold since the late 1990s.
| The head and shoulders pattern in technical analysis is most commonly seen as a reversal pattern. As this Great Graphic (created on Bloomberg) illustrates, the price action appears to have traced out such a pattern and today’s advance break the neckline.
It is not ideal. It is not coming at the end of a large downmove, though the euro has pulled back from the two-year high set in September. Also, the measuring objective would is near $1.2150, which is above that September high. However, we note that it is near the 50% retracement objective of the euro’s decline from the mid-2014 high near $1.40. The weekly MACDs and Slow Stochastics are about to cross higher. There are a couple notes of caution. First, the euro has shot through the upper Bollinger Band (~$1.1900). It gains over the past two sessions appear to be taking place in thin activity. Second, next week, there are several key events, including the likely Senate vote on its tax reform bill, Powell’s confirmation hearings, and the release of the Fed’s targeted inflation measure, the October core PCE deflator, which is expect to rise. Third, the US premium over Germany on two-years, makes it the most expensive to hold euro against the dollar since the late 1990s. |
EUR/BGN Currency |
Tags: #USD,$EUR,Featured,Great Graphic,newsletter

