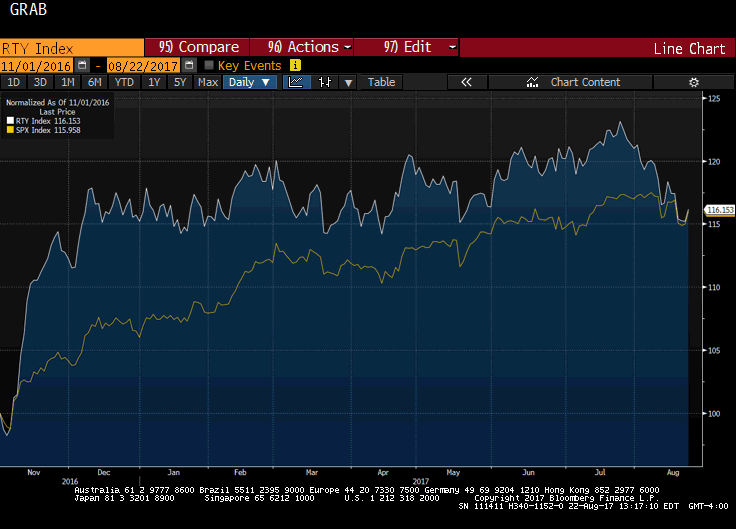
The Russell 2000, which tracks the 2000 smallest companies in the Russell 3000, is threatening to turn positive for the year. It had turned negative in the second half of last week. Many pundits saw its decline and the penetration of the 200-day moving average for the first time in over a year as a sign of an impending down move in the broader equity market. Given valuation, and the number of big name asset managers and hedge funds who have come out over the past week expressing concerns about the trajectory of the markets, there are indeed plenty of reasons for investors to be cautious. However, we suspect there is something else behind the small caps’ underperformance. We suspect the proper place to begin the
Topics:
Marc Chandler considers the following as important: equities, Featured, FX Trends, Great Graphic, newsletter, SPY
This could be interesting, too:
Nachrichten Ticker - www.finanzen.ch writes Die Performance der Kryptowährungen in KW 9: Das hat sich bei Bitcoin, Ether & Co. getan
Nachrichten Ticker - www.finanzen.ch writes Wer verbirgt sich hinter der Ethereum-Technologie?
Martin Hartmann writes Eine Analyse nach den Lehren von Milton Friedman
Marc Chandler writes March 2025 Monthly
| The Russell 2000, which tracks the 2000 smallest companies in the Russell 3000, is threatening to turn positive for the year. It had turned negative in the second half of last week. Many pundits saw its decline and the penetration of the 200-day moving average for the first time in over a year as a sign of an impending down move in the broader equity market.
Given valuation, and the number of big name asset managers and hedge funds who have come out over the past week expressing concerns about the trajectory of the markets, there are indeed plenty of reasons for investors to be cautious. However, we suspect there is something else behind the small caps’ underperformance. We suspect the proper place to begin the story was with the US election last year. We created the above Great Graphic on Bloomberg to illustrate this point. The white line depicts the Russell 2000, and the yellow line represents the S&P 500. We indexed both time series to start at 100 on November 1 last year. The Russell 2000 clearlyled the S&P 500 higher on Trump’s electoral victory. They started off this year pretty even early February, but since then the S&P 500 outperformed. However, it was not until late-July that the Russell 2000 began moving lower. |
RTY Index |
We suspect that the driving force was the unwinding of the Trump Trade. Many investors have become increasingly skeptical of the Administration’s ability to enact its economic program of deregulation, tax reform, and infrastructure spending. However, in recent days, some observers have become more confident that tax reform will pass this year. The idea is that the recent miscue put pressure on the President to be able to point to some significant success (and no, a nomination to the Supreme Court does not meet this test). Who does not want tax reform?
Hope is trumping realpolitik analysis. First, the Republicans have been trying to draft tax reform without trying to draw on moderate Democrats. This was also the case with healthcare reform. The problem is that the Republican Party is unified in name only. There are two powerful wings, represented by the Freedom Caucus and the Tuesday Group, that may be further apart than some moderate Democrats and some moderate Republicans. The Democrat leadership summed up their demands in a way that brings the fissures in the Republican Party into relief. The two demands are that the top 1% do not get a cent of tax relief and the tax reform is deficit neutral.
Treasury Secretary Mnuchin says that tax reform is better than tax cuts, but tax cuts are better than none. Thissuggests the priority is getting something done, implying the overriding desire to get something done. But, surely the White House desire to repeal and replace the Affordable Care Act was similarly robust. Moreover, big legislation such as tax reform seems to requires experience and a skill set that may not be in large supply in the Administration.
The Russell 2000 fell about 7% since peaking on July 25 through the end of last week. From a technical perspective, it looks set to recover. A move above 1380-1390 would reinforce the 1350 area which has marked the lower end of the range since the start of the year.
Tags: equities,Featured,Great Graphic,newsletter,SPY

