Swiss Franc Currency Index The Swiss Franc index remained in a losing position compared to the dollar index. However since November 25, it has remained stable. Given that the ECB extended the QE period, the EUR/CHF has fallen to 1.0730 again. Trade-weighted index Swiss Franc, December 09(see more posts on Swiss Franc Index, ) Source: FT.com - Click to enlarge Swiss Franc Currency Index (3 years) The Swiss Franc index is the trade-weighted currency performance (see the currency basket) On a three years interval, the Swiss Franc had a weak performance. The dollar index was far stronger. The dollar makes up 33% of the SNB portfolio and 25% of Swiss exports (incl. countries like China or Arab countries that use the dollar for exchanges). Contrary to popular believe, the CHF index gained only 1.73% in 2015. It lost 9.52% in 2014., when the dollar (and yuan) strongly improved. Swiss Franc Currency Index, December 09(see more posts on Swiss Franc Index, ) Source: FT.com - Click to enlarge USD/CHF The US dollar is finishing the year on a firm note. It rose to a multi-month high against the yen and against CHF before the weekend. The euro remains within spitting distance of the bottom of its two-year range near .05.
Topics:
George Dorgan considers the following as important: Australian Dollar, British Pound, Canadian Dollar, Crude Oil, EUR-USD, EUR/CHF, Euro, Euro Dollar, Featured, FX Trends, Japanese Yen, MACDs, newslettersent, S&P 500 Index, S&P 500 Index, Swiss Franc Index, U.S. Treasuries, US Dollar Index, USD/CHF, USDJPY
This could be interesting, too:
Nachrichten Ticker - www.finanzen.ch writes Die Performance der Kryptowährungen in KW 9: Das hat sich bei Bitcoin, Ether & Co. getan
Nachrichten Ticker - www.finanzen.ch writes Wer verbirgt sich hinter der Ethereum-Technologie?
Marc Chandler writes March 2025 Monthly
Mark Thornton writes Is Amazon a Union-Busting Leviathan?
Swiss Franc Currency IndexThe Swiss Franc index remained in a losing position compared to the dollar index. However since November 25, it has remained stable. Given that the ECB extended the QE period, the EUR/CHF has fallen to 1.0730 again. |
Trade-weighted index Swiss Franc, December 09(see more posts on Swiss Franc Index, )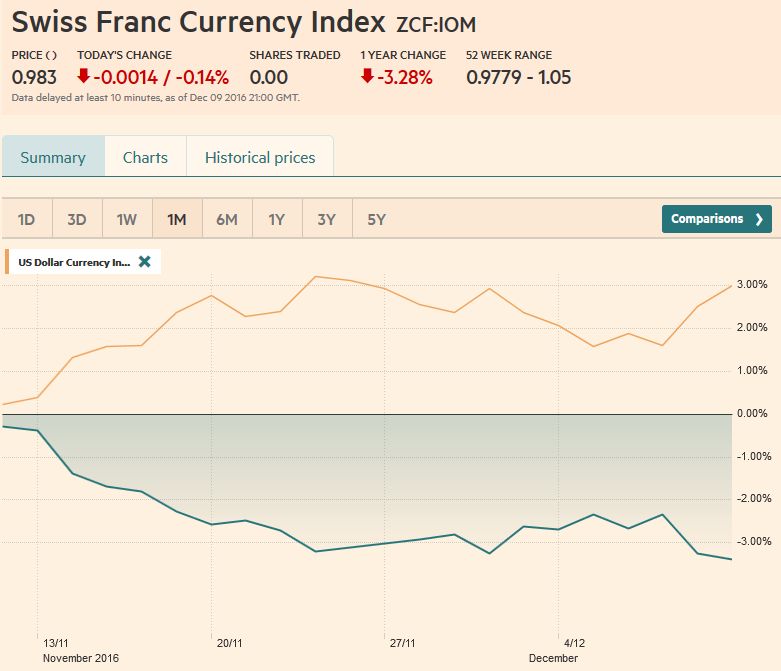 Source: FT.com - Click to enlarge |
Swiss Franc Currency Index (3 years)The Swiss Franc index is the trade-weighted currency performance (see the currency basket)On a three years interval, the Swiss Franc had a weak performance. The dollar index was far stronger. The dollar makes up 33% of the SNB portfolio and 25% of Swiss exports (incl. countries like China or Arab countries that use the dollar for exchanges). Contrary to popular believe, the CHF index gained only 1.73% in 2015. It lost 9.52% in 2014., when the dollar (and yuan) strongly improved. |
Swiss Franc Currency Index, December 09(see more posts on Swiss Franc Index, )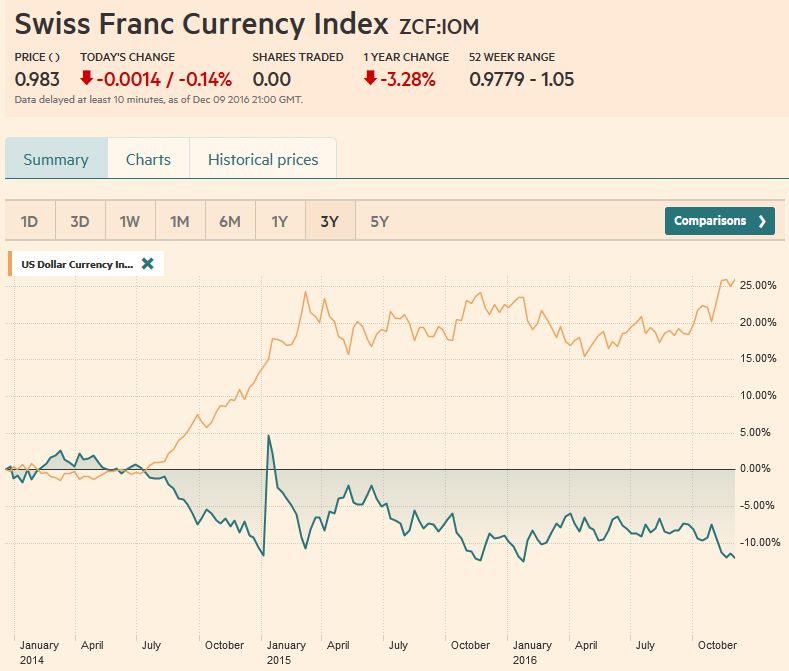 Source: FT.com - Click to enlarge |
USD/CHFThe US dollar is finishing the year on a firm note. It rose to a multi-month high against the yen and against CHF before the weekend. The euro remains within spitting distance of the bottom of its two-year range near $1.05. Over the past month, dollar pullbacks have been generally shallow and brief.
Next week’s FOMC meeting is the last big event of the year. The dollar may continue to be well supported ahead of the meeting where a rate hike is fully discounted. The Fed officials may revise up growth and inflation forecasts, and still not take into account
the extent of fiscal stimulus that may be delivered. The President-elect’s team has indicated the initial economic focus will be on trade, not taxes or stimulus. Nevertheless, investors anticipate both fiscal stimulus and a more hawkish configuration at the Federal Reserve. At
the same time, the ECB will be expanding its balance sheet by 780 bln euros next year, and the BOJ’s extraordinary monetary policy is set to continue, augmented by modest fiscal stimulus. Also, while many emerging-market central banks have been reducing their Treasury holdings to support their currencies, private sector demand has been strong, with European investor interest reported. Americans appear to be liquidating some of their holdings for foreign bonds. Foreign investors have returned to the Japanese equity market, but it appears to be mostly on a currency-hedged basis.
|
US Dollar/Swiss Franc FX Spot Rate, December 09(see more posts on USD/CHF, )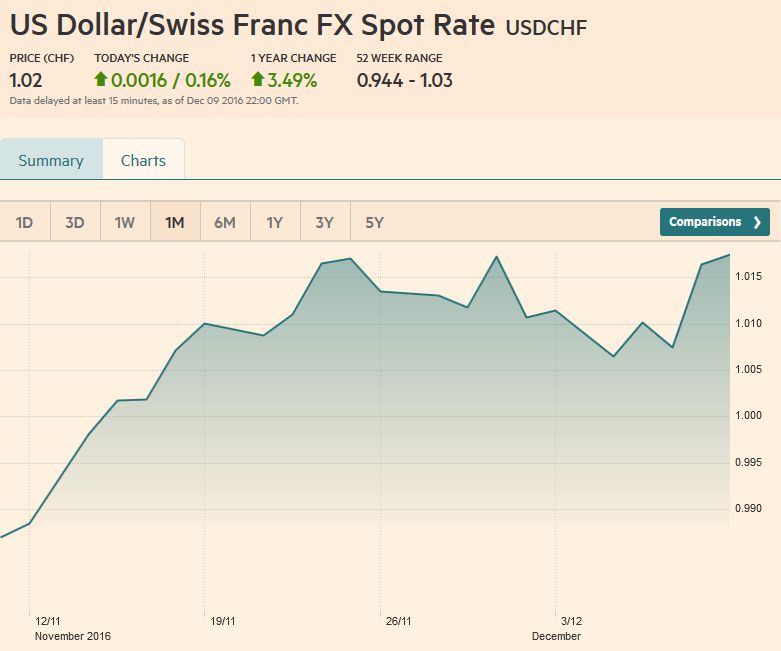 Source: FT.com - Click to enlarge |
US Dollar IndexWe had anticipated the US Dollar Index to fall The speed of the Dollar Index ‘s recovery means that MACDs and Slow Stochastics have not crossed higher to generate new buy signals, though they may turn early next week. Remember, the 101.80 area is the 61.8% retracement of the decline since from the 121.00 level seen in July 2001. |
US Dollar Currency Index, December 09(see more posts on Dollar Index, )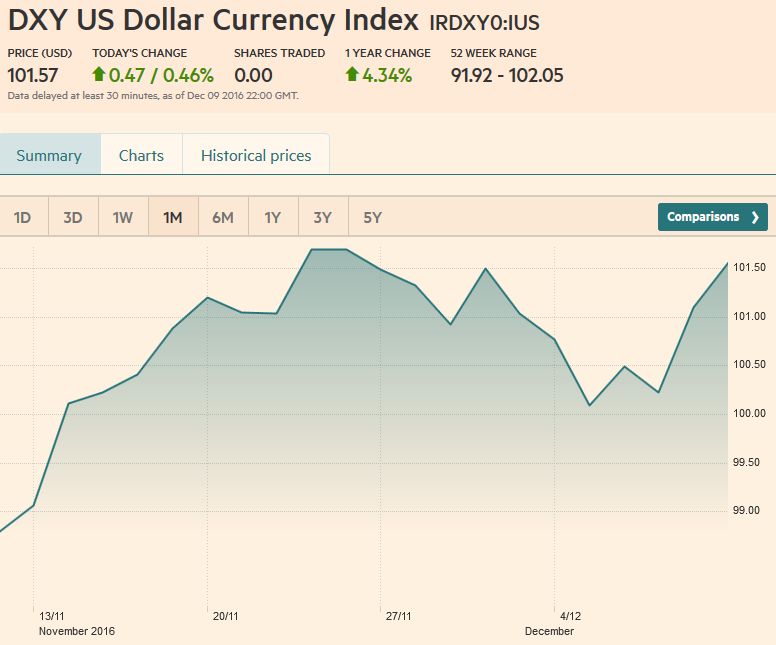 Source: FT.com - Click to enlarge |
EUR/USDEuro bounces from the $1.05 level appear We expect the $1.05 support area yield, with the euro heading toward $1.0430-$1.0450 before corrective pressure emerges again. If the $1.05 is not broken, momentum traders will be sorely disappointed, and a bounce back to $1.07 would not surprise. |
Euro/US Dollar FX Spot Rate, December 09(see more posts on EUR / USD, )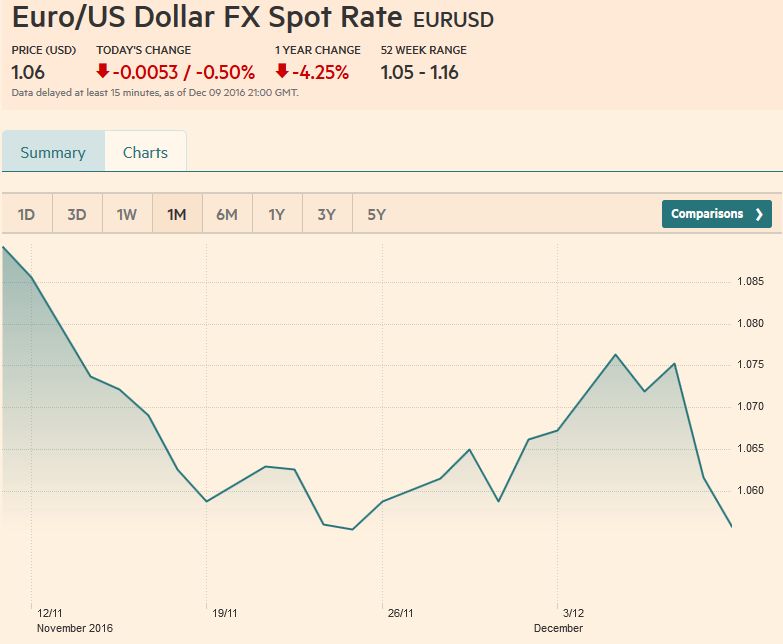 Source: FT.com - Click to enlarge |
USD/JPYThe last session was the first since February that the US dollar remained above JPY114.00. In fact, it made a new 10-month high near JPY115.30. The JPY115.60 area corresponds to a 61.8% retracement of the dollar’s decline since reaching almost JPY126 in June 2015. Above there, the is initial potential toward JPY116.00-JPY116.20. The technical indicators have not confirmed the new dollar highs, but the momentum is strong. Initial support is seen near JPY114.50. |
US Dollar / Japanese Yen FX Spot Rate, December 09(see more posts on USD/JPY, )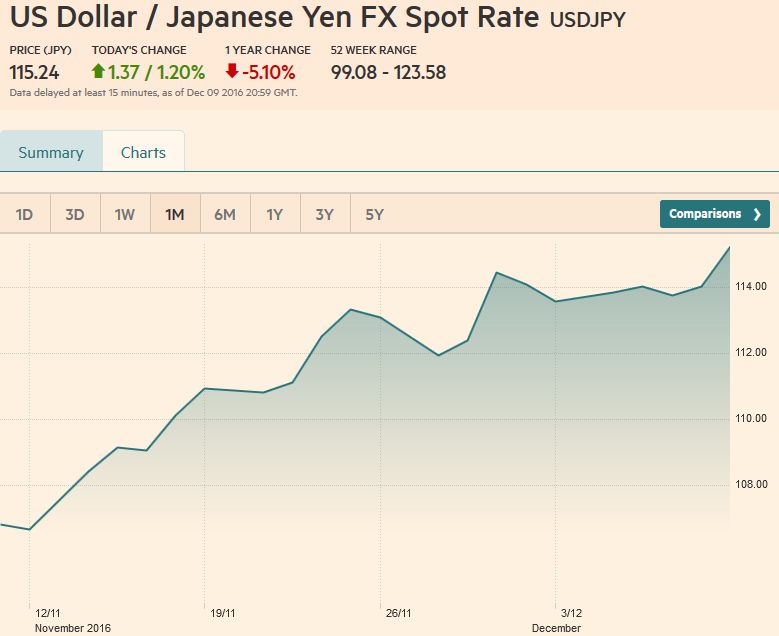 Source: FT.com - Click to enlarge |
GBP/USDWhile the yen was the weakest currency last week, shedding almost 1.5%, sterling was just behind it with a 1.25% decline. Sterling snapped a two-week advance. Disappointing data, broad dollar strength, and the UK parliament’s support for the government’s timetable of triggering Article 50 took a toll. Early in the week, sterling had reached $1.2775, its highest level since just before the flash crash, but just shy of the 100-day moving average (~$1.2795). It has not traded above that moving average since the referendum. The $1.25 area offers initial support, and a break could see $1.24 in short order. A break of $1.23 would likely signal the end of the two-month correction. The RSI has turned down. The MACDs and Slow Stochastics may rollover near week. |
UK Pound Sterling / US Dollar FX Spot Rate, December 09(see more posts on British Pound, )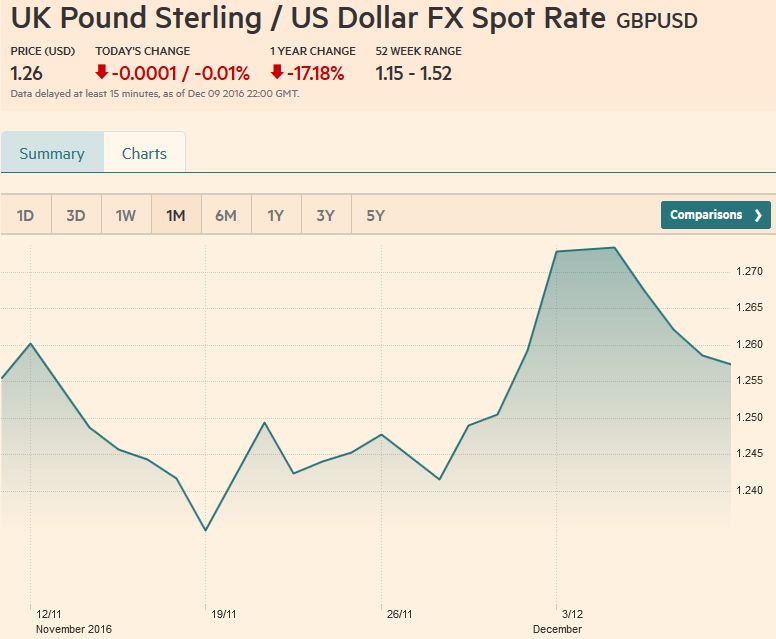 Source: FT.com - Click to enlarge |
AUD/USDThe Australian dollar has been stymied by $0.7500. The surprisingly poor Q3 GDP (-0.5%) and larger trade deficit (A$1.5 bln) neutralized the impact of higher metal prices and stronger China imports. The technical indicators are mixed, which could be resolved by some more sideways activity. A break of $0.7430 would likely signal a test on $0.7380 initially but possibly back to $0.7300. |
Australian Dollar / US Dollar FX Spot Rate, December 09(see more posts on Australian Dollar, )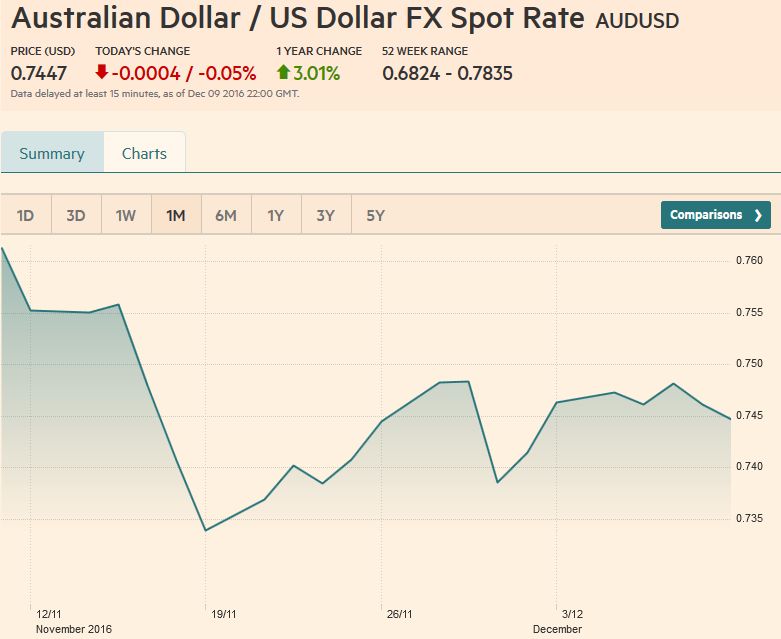 Source: FT.com - Click to enlarge |
USD/CADIn contrast, the Canadian dollar was the strongest of the majors, gaining 2% against the US dollar. Steady oil prices at elevated levels and the fact that Canada’s discount on two-year money finished at the lows for the week may have been contributing factors.
Typically, the Canadian dollar performs well in a strong US dollar environment. Last month, the US dollar was repulsed after testing the 50% retracement objective of the down move since the multi-year high was set at the start of the year a little below CAD1.4700.
Technical indicators are getting stretched, and the Canadian dollar strengthened six of the past seven sessions. If the move is not exhausted, there may be one more leg down toward CAD1.3080. A move back above CAD1.3220 may be the first sign that the US dollar has bottomed.
|
US Dollar / Canadian Dollar FX Spot Rate, December 09(see more posts on Canadian Dollar, )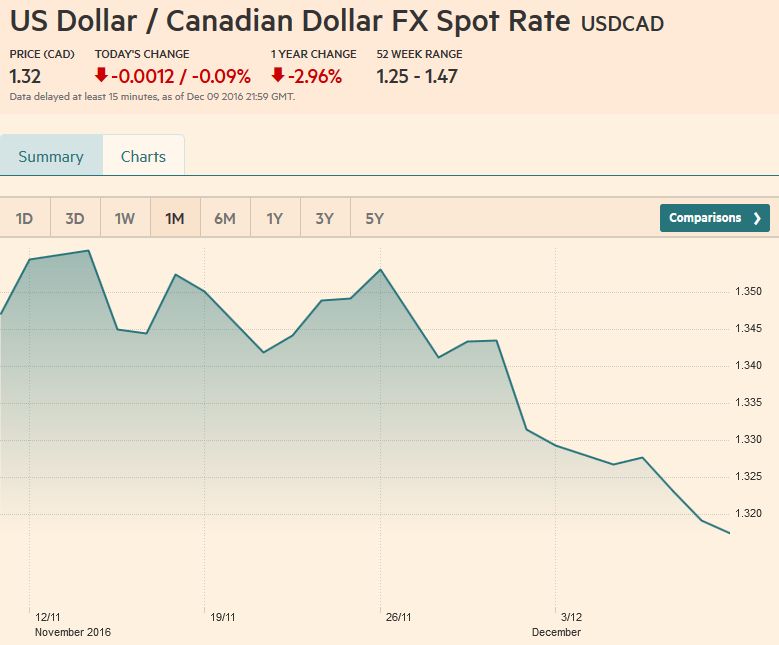 Source: FT.com - Click to enlarge |
Crude OilTechnical indicators suggest the January light Support is seen in the $49.20-$49.60 band. Although one may rightfully skeptical about OPEC and non-OPEC output cuts, our reading of the charts suggests being patient to pick a top in oil. |
Crude Oil, December 09(see more posts on Crude Oil, )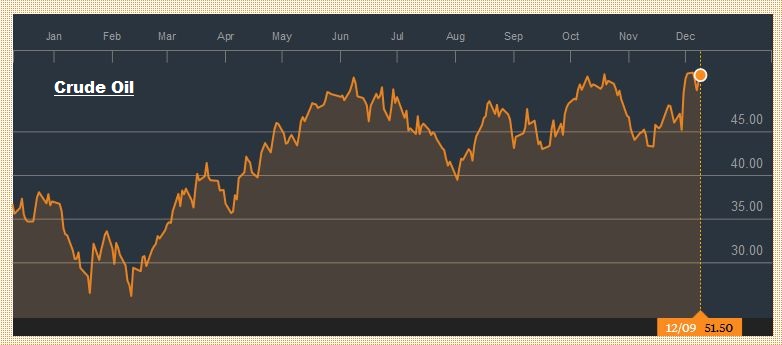 Source: Bloomberg.com - Click to enlarge |
U.S. TreasuriesThe US 10-year yield rose 11 bp between Thursday’s low and Friday’s high. The 3.25% rally in oil prices over those two days and the backing up in the European rates are probably the two main culprits. The 2.50% level is technically and psychologically important. The March note futures contract is pinned near 124-00, closing just below there before the weekend. The December 1 low was 123-20. Beyond that, there is little on the charts (continuation contract) until closer to 122-24, the lows from 2014. The March contract has not been above its 20-day moving average since the election; It |
Yield US Treasuries 10 years, December 09(see more posts on U.S. Treasuries, )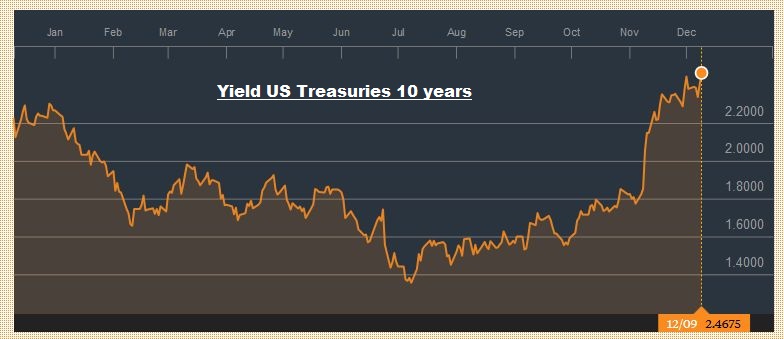 Source: Bloomberg.com - Click to enlarge |
S&P 500 IndexThe S&P 500 rose for the past six
sessions. The streak is the longest since June 2014 when it also rose for six sessions. It is the fourth gain in five weeks. While there is a sense the market is stretched, the technical indicators warn against getting bearish. The pre-weekend close was strong, near the session highs, for a new record. Dow Theory would note that both transports and industrials made new record highs, confirming the strength of the bull market. Over the past month, with the exception of three or four sessions, the five-day moving average has rarely been penetrated. It comes in near 2231. A break could be an early warning sign that corrective pressures are getting the upper hand.
|
S&P 500 Index, December 09(see more posts on S&P 500 Index, )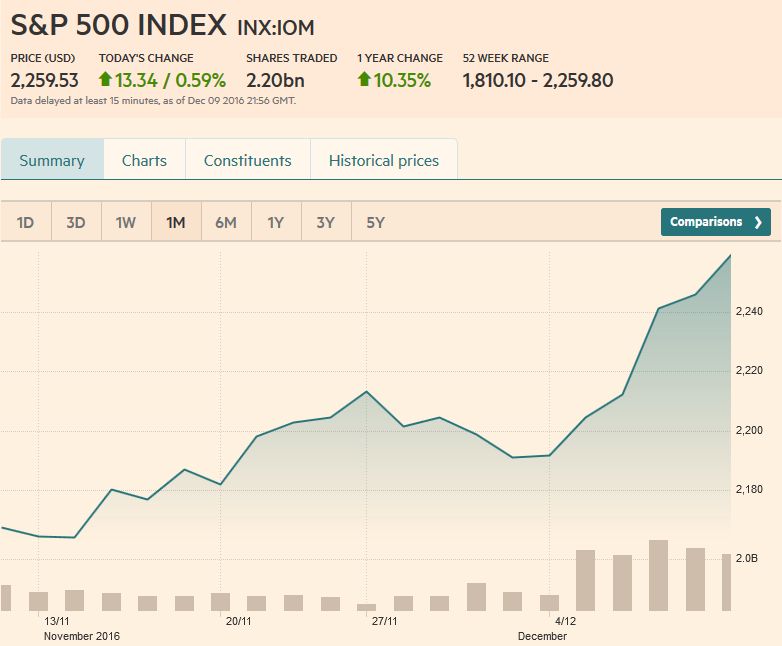 Source: FT.com - Click to enlarge |
Tags: Australian Dollar,British Pound,Canadian Dollar,Crude Oil,Dollar Index,EUR / USD,EUR/CHF,Euro,Euro Dollar,Featured,Japanese yen,MACDs,newslettersent,S&P 500 Index,Swiss Franc Index,U.S. Treasuries,USD/CHF,USD/JPY
