The recent ‘flash crash’ in equities was unusual by several measures. After ‘goldilocks’, equity markets have entered a new regime.The global equity market sell-off of late January and early February was rather unusual in a number of respects.Equity and bond prices declined simultaneously in the recent market sell-off, a pattern that has only occurred in a quarter of the last 25 equity market sell-offs.The recent sell-off is far above the levels seen in the past two years, because the timings of the increase in long-term rates and of the acceleration in the equity market sell-off were different. Furthermore, only one third (8 out of 25 equity sell-offs) were more severe in the US than in Europe.The pattern in implied volatility was even more unusual. Starting from a very low level (for
Topics:
Jacques Henry considers the following as important: Macroview
This could be interesting, too:
Cesar Perez Ruiz writes Weekly View – Big Splits
Cesar Perez Ruiz writes Weekly View – Central Bank Halloween
Cesar Perez Ruiz writes Weekly View – Widening bottlenecks
Cesar Perez Ruiz writes Weekly View – Debt ceiling deadline postponed
The recent ‘flash crash’ in equities was unusual by several measures. After ‘goldilocks’, equity markets have entered a new regime.
The global equity market sell-off of late January and early February was rather unusual in a number of respects.
Equity and bond prices declined simultaneously in the recent market sell-off, a pattern that has only occurred in a quarter of the last 25 equity market sell-offs.
The recent sell-off is far above the levels seen in the past two years, because the timings of the increase in long-term rates and of the acceleration in the equity market sell-off were different. Furthermore, only one third (8 out of 25 equity sell-offs) were more severe in the US than in Europe.
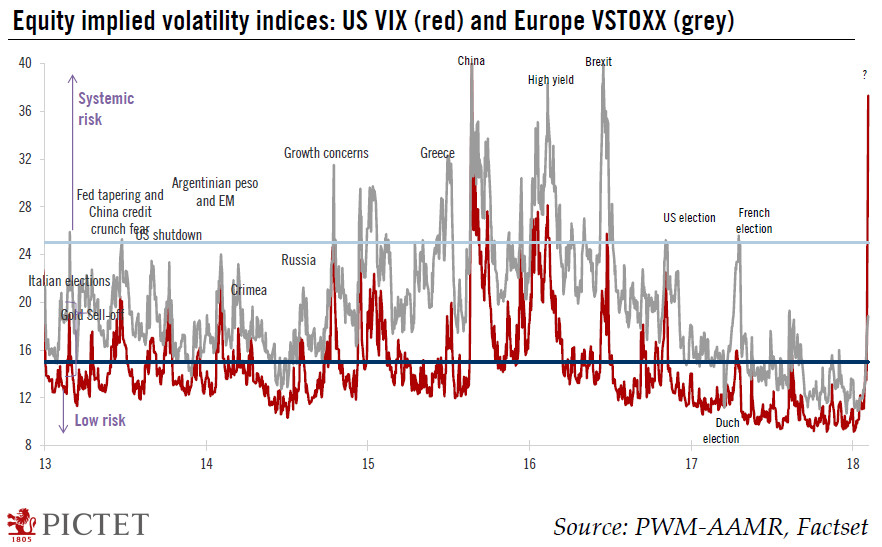
The pattern in implied volatility was even more unusual. Starting from a very low level (for most of 2017 it remained between 10 and 12), the CBOE Volatility Index touched an intraday high of 50.3 on February 6 and was not associated with any exogenous systemic risk.
Furthermore, unlike European and Japanese volatility term structures, an inversion occurred in the US during the recent market sell-off. In general, the opposite happens in episodes of stock market drawdowns. In addition, investors’ hedging of equities exploded, causing the volatility skew to skyrocket to a level observed only during the 2008 global financial crisis.
Such extreme moves in the volatility skew cannot be exclusively due to long-only, passive investors. The pattern is best explained by investors’ efforts to reposition their portfolios. The usual suspects are to be found in the following quantitative-driven strategies: volatility targeting strategies; commodity trading advisors’ (CTA) trend-following strategies; and risk-parity funds.
These quantitative strategies collectively have had a massive direct impact on implied volatility and on equities due to their high equity allocation.
As volatility is a means-reverting process, a spike in volatility is usually a good buying opportunity. Yet investors should bear in mind that adjustments in volatility take time to unfold and are asymmetrical: volatility can skyrocket quite suddenly and decrease only gradually. We believe we have entered just such a market regime.