Volatility in US payroll data has remained low lately. We see limited signs of imminent overheating or slowing in the US.Volatility has picked up significantly on US equity markets lately. But does it reflect higher volatility in US macroeconomic data?So far, not really. Take US payroll data. If one looks at the one-year rolling standard deviation of the monthly data, one can see volatility is still subdued: it now stands at 68,000 (new payrolls/month), which is close to the average since 2013 (65,000). The lowest one-year standard deviation was reached in the 12 months to February 28, 2015 (36,000).Volatility in payroll data shifted down a gear from the pre-financial crisis years. In other words, employment has been recovering steadily from the recession, with little variability from one
Topics:
Thomas Costerg considers the following as important: Macroview, US economy, US GDP growth, US macro volatility, US payrolls
This could be interesting, too:
Cesar Perez Ruiz writes Weekly View – Big Splits
Cesar Perez Ruiz writes Weekly View – Central Bank Halloween
Cesar Perez Ruiz writes Weekly View – Widening bottlenecks
Cesar Perez Ruiz writes Weekly View – Debt ceiling deadline postponed
Volatility in US payroll data has remained low lately. We see limited signs of imminent overheating or slowing in the US.
Volatility has picked up significantly on US equity markets lately. But does it reflect higher volatility in US macroeconomic data?
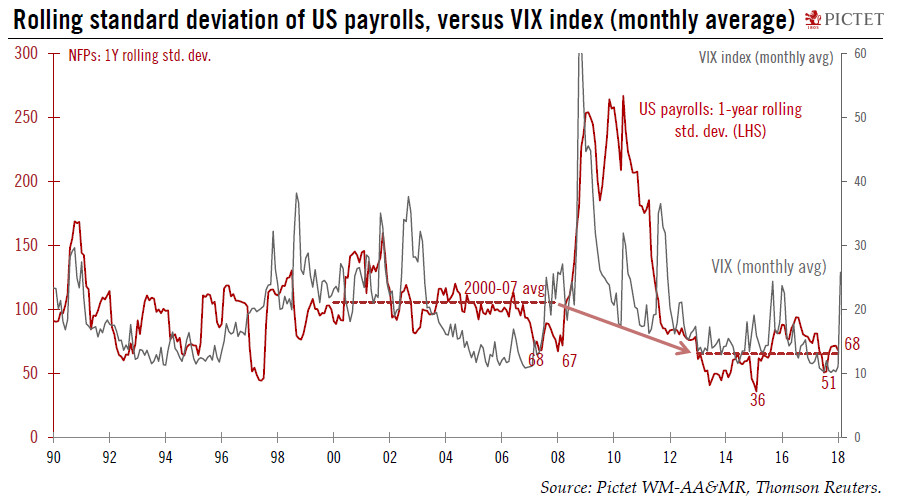
So far, not really. Take US payroll data. If one looks at the one-year rolling standard deviation of the monthly data, one can see volatility is still subdued: it now stands at 68,000 (new payrolls/month), which is close to the average since 2013 (65,000). The lowest one-year standard deviation was reached in the 12 months to February 28, 2015 (36,000).
Volatility in payroll data shifted down a gear from the pre-financial crisis years. In other words, employment has been recovering steadily from the recession, with little variability from one month to the next. From 2000 to 2007, the standard deviation in monthly payrolls was 106,000 (see graph).
Are there signs that macro volatility could pick up in the near term? One way to answer this question is to gauge signs of imminent overheating or slowing. Regarding overheating risks, we still see some room for the US economy to absorb further slack in the labour market. We note that recent gains in wage growth were not broadly based, but rather concentrated in the upper echelons of the labour market. And unless financial conditions fail to normalise in the coming days, there are no signs of any slowdown in the economy either. Weekly initial jobless claims remain very low, and employment growth is in fact accelerating—consistent with our view that US growth is picking up, driven by investment. Macro volatility could pick up modestly in the coming months, in our view, as US GDP growth accelerates to 3% annual growth this year.