The contrasting growth trajectories of Texas, California and Illinois find echoes in other countries.US growth has been solid lately. However, drilling down into state-level data, we can see wide discrepancies in growth from one US state to the next. Indeed, a lot of the growth ‘heavy lifting’ in recent years has been done by Texas, propelled by oil production, and by California, propelled by the tech boom. More recently, we have seen a increased contribution to US growth from Florida too, helped by a sharp improvement in its real estate market.This week, we illustrate this multi-speed growth picture by comparing the trajectory of GDP, since 2006, of the three key states of California, Texas and Illinois (respectively the biggest, second-biggest and fifth-biggest US state by GDP)
Topics:
Thomas Costerg considers the following as important: Macroview
This could be interesting, too:
Cesar Perez Ruiz writes Weekly View – Big Splits
Cesar Perez Ruiz writes Weekly View – Central Bank Halloween
Cesar Perez Ruiz writes Weekly View – Widening bottlenecks
Cesar Perez Ruiz writes Weekly View – Debt ceiling deadline postponed
The contrasting growth trajectories of Texas, California and Illinois find echoes in other countries.
US growth has been solid lately. However, drilling down into state-level data, we can see wide discrepancies in growth from one US state to the next. Indeed, a lot of the growth ‘heavy lifting’ in recent years has been done by Texas, propelled by oil production, and by California, propelled by the tech boom. More recently, we have seen a increased contribution to US growth from Florida too, helped by a sharp improvement in its real estate market.
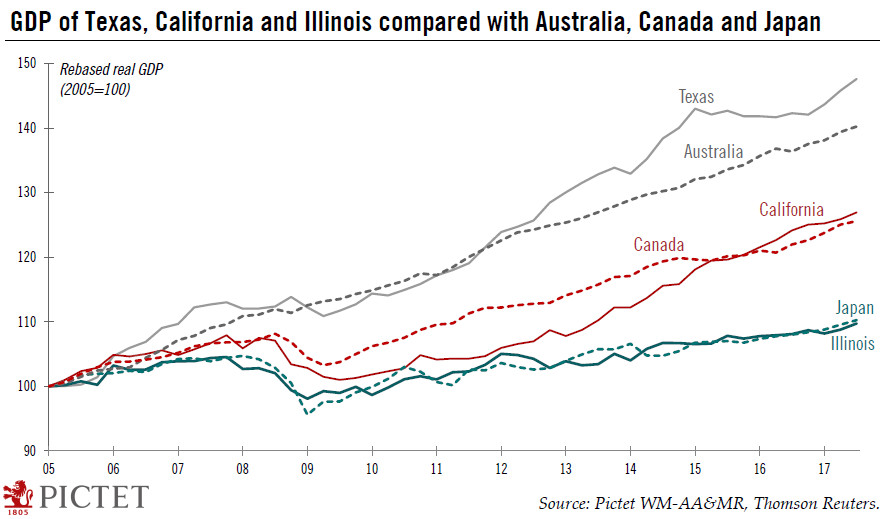
This week, we illustrate this multi-speed growth picture by comparing the trajectory of GDP, since 2006, of the three key states of California, Texas and Illinois (respectively the biggest, second-biggest and fifth-biggest US state by GDP) respectively with Canada, Australia and Japan. It is in fact quite surprising to see such a good ‘fit’ between the sluggish growth path of Japan and of Illinois over the past 12 years. This is a reminder of challenges facing Illinois and the ‘Rust Belt’, manufacturing-oriented areas in the North and North East of the US at large. The compounded annual growth of Illinois since 2006 has been only 0.6% per annum, compared with 0.7% for Japan. The US average is 1.5%.
It is difficult to find an alter ego for Texas GDP, since its growth rate has been more erratic in recent years, affected by the vagaries of its oil-and-gas sector. Hiccups in the US energy sector indeed in 2016 almost drove Texas into recession, but helped by the rebound in global oil prices, its fortunes have turned. Texas’s compound annual growth rate has been 3.0% since 2006, and in Q3 2017 it expanded a solid 3.7% y-o-y. Texas tracked Australia’s growth trajectory fairly closely between 2006-2012, but since then it has left this other commodity-rich economy behind. Australia grew 2.8% y-o-y in Q3 2017.