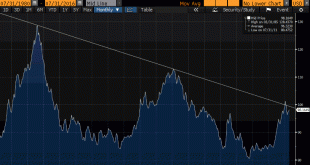
Summary: The real broad trade-weighted dollar index rose in July for the third month. It peaked in January above trendline drawn through the Reagan and Clinton dollar rallies. Expect the trendline to be violated again before the end of the year. This Great Graphic, created on Bloomberg, depicts the Federal Reserve’s real broad trade-weighted index of the dollar. Real means that it is adjusted for inflation...
Read More »Great Graphic: Relative Performance of Bank Stocks–US, Europe, and Japan
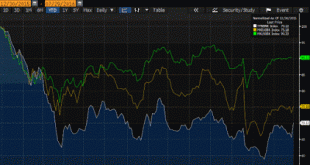
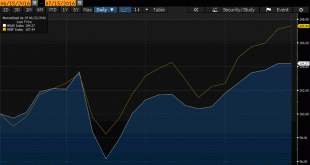
This Great Graphic was composed on Bloomberg, and it shows the performance of bank share indices of the major bourses. The time series are indexed to 100 at the start of this year. The green line, which is off about 6.6% this year is the MSCI US bank index. The yellow line is the MSCI European bank index. It is off 25% this year. The white line is the Topix bank shares. It is fallen 30% this year, even with...
Read More »Great Graphic: How the US Recovery Stacks Up
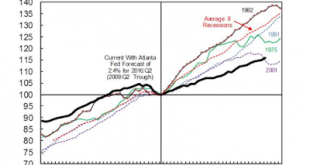
Summary: The US recovery may have surpassed the 2001 recovery in Q2. Though disappointing, the recovery has been faster than average from a balance sheet crisis. Although slow, it is hard to see the secular stagnation in the data. This Great Graphic was tweeted Alan Kruger (@Alan_Kruger). Drawing on official data and the Atlanta Fed’s GDP Now tracker for Q2 GDP (2.4%), it shows the current business cycle in...
Read More »Great Graphic: Aussie Approaches Two-Month Uptrend
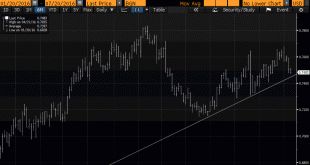
Summary: Australian dollar is the second heaviest currency this week after a key downside reversal at the end of last week. It is approaching an uptrend line near $0.7450. Many perceive an increased likelihood that the RBA eases and many are reassessing chance of a Fed hike later this year. Australian dollar The Australian dollar recorded a key downside reversal last Friday (July 15) and had seen follow...
Read More »Great Graphic: Equities Since Brexit
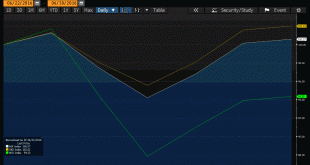
Since the UK voted to leave the EU, emerging market equities have outperformed equities from the developed markets. This Great Graphic, composed on Bloomberg, shows the MSCI Emerging Market equities (yellow line) and the MSCI World Index of developed equities (white line). Both time series are indexed as to June 15, but they were at nearly identical levels as the UK voted. The developed market equities fell more...
Read More »Great Graphic: If You Think Sterling has Bottomed, Where may it Go?
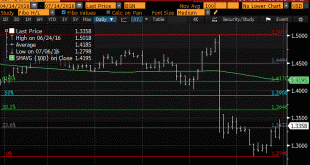
Summary: Many think sterling has bottomed. A number of technical factors point to potential toward $1.42. Fundamental considerations do not appear as supportive as technicals. With the Bank of England apparently surprising the market more than one might have expected, given the split surveys, many are thinking sterling has bottomed. If it has bottomed, where could it go? A number of technical...
Read More »Great Graphic: The Yuan’s Weakness
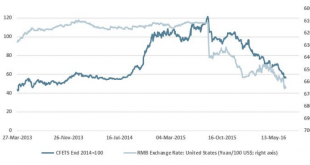
Summary Don’t be fooled, the yuan has fallen more against its basket that against the dollar this year. It is not clear what China means by stable. Market forces appear to be moving in the same direction as officials wish. Here are two Great Graphics that portray two time series: the dollar-yuan exchange rate and the yuan against a trade-weighted basket. The first chart comes from a highly reputable...
Read More »Great Graphic: What are UK Equities Doing?
Summary Domestic-oriented UK companies have been marked down. The outperformance by UK’s global companies is a negative view of sterling. The drop in interest rates is in anticipation of a recession and easier BOE policy. Some observers argue the media and some economists are exaggerating the impact of the UK vote a week ago. They talk about the petition for a second referendum. They about Scotland vetoing the...
Read More »Great Graphic: UK Referendum–Turnout it Key
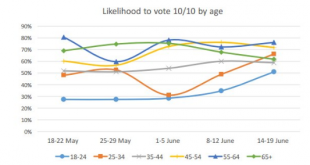
Summary Younger voters are more supportive of the EU. There has been an increase in the intention of younger cohorts to vote. There has been a decline in the intention of some older cohorts to vote. We showed that younger age cohorts in the UK are more inclined to vote to stay in the EU than their elders. However, some suggested that this consideration is blunted by the fact that the younger people are less...
Read More »Great Graphic: Age and Brexit
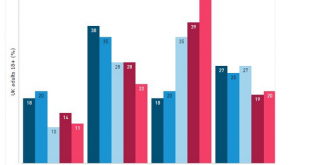
The betting and events markets have shifted more decisively than the polls in favor of the UK to remain in the EU. Sterling extended its rally from $1.4010 last Thursday to nearly $1.4785 today, as the market participants adjust positions. What is particular striking is that the asymmetrical perceptions of the personal impact of a vote to leave the EU. The Great Graphic here was posted on Business Insider,...
Read More » Swiss Economicblogs.org

