This post is extremely important for understanding the differences between CPI inflation in Europe and in the U.S. “Shelter” makes up 32.8% of the U.S. CPI basket, or 42% of the core inflation rate. It is mostly driven by “Owner’s equivalent rent of primary residence”. Shelter inflation in the U.S. is 3.2% per year (March 2016), but shelter inflation is only 1% in Europe. CPI in the United States (source) in % Shelter 32.776 Rent of primary residence 5.930 Lodging away from home 2.648 Housing at school, excluding board (2) .154 Other lodging away from home including hotels and motels (3) 2.493 Owners’ equivalent rent of primary residence 23.830 Tenants’ and household insurance .369 Moreover, rents make up 6.4% of the CPI basket in the euro zone and most importantly, the “owner’s equivalent rent of primary residence” does not exist in the European CPI basket. Both CPI baskets contain energy and other costs for housing, about 10% of the total. This implies that rising inflation and costs for rents and owner-occupied housing push up the inflation differences between the U.S. and the euro zone. It leads to the thinking that the Fed must raise rates, what again pushes up costs for owner-occupied housing, hence higher rates push up inflation. In nearly all European countries rents are controlled by an indexing to interest rates.
Topics:
Marc Chandler considers the following as important: Featured, FX Trends, Great Graphic, newsletter
This could be interesting, too:
Nachrichten Ticker - www.finanzen.ch writes Die Performance der Kryptowährungen in KW 9: Das hat sich bei Bitcoin, Ether & Co. getan
Nachrichten Ticker - www.finanzen.ch writes Wer verbirgt sich hinter der Ethereum-Technologie?
Martin Hartmann writes Eine Analyse nach den Lehren von Milton Friedman
Marc Chandler writes March 2025 Monthly
This post is extremely important for understanding the differences between CPI inflation in Europe and in the U.S. “Shelter” makes up 32.8% of the U.S. CPI basket, or 42% of the core inflation rate. It is mostly driven by “Owner’s equivalent rent of primary residence”. Shelter inflation in the U.S. is 3.2% per year (March 2016), but shelter inflation is only 1% in Europe.
CPI in the United States (source) in % Shelter 32.776 Rent of primary residence 5.930 Lodging away from home 2.648 Housing at school, excluding board (2) .154 Other lodging away from home including hotels and motels (3) 2.493 Owners’ equivalent rent of primary residence 23.830 Tenants’ and household insurance .369 Moreover, rents make up 6.4% of the CPI basket in the euro zone and most importantly, the “owner’s equivalent rent of primary residence” does not exist in the European CPI basket. Both CPI baskets contain energy and other costs for housing, about 10% of the total.
This implies that rising inflation and costs for rents and owner-occupied housing push up the inflation differences between the U.S. and the euro zone.
It leads to the thinking that the Fed must raise rates, what again pushes up costs for owner-occupied housing, hence higher rates push up inflation.
In nearly all European countries rents are controlled by an indexing to interest rates. The landlord is only allowed to hike rents when he has higher costs, i.e. when he must pay higher interest rates.
Hence the key differences are:
- Rents are 6% of the US CPI basket, 6.4% of the euro zone HICP basket.
- Owner’s equivalent rent of primary residence are 23.8% of the US basket, but 0% (zero!) of the euro zone basket.
- Rent-control measures in Europe, no or weak rent control in the U.S.
- US Shelter inflation 3.2%, Euro zone rent inflation 1%
- Asset-price inflation may lead into higher inflation (potentially hyper inflation) in the U.S., while regulation controls asset-price inflation in Europe.
Marc Chandler argues that asset price inflation does not lead to hyper inflation.
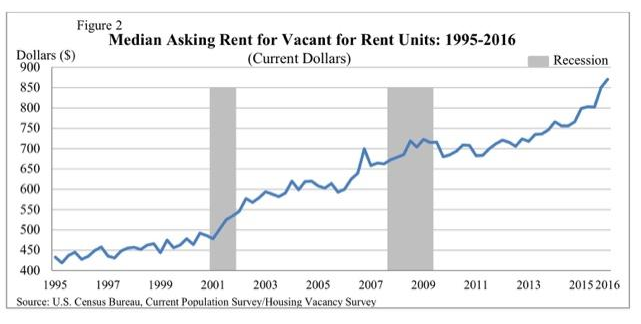
Median Asking Rent for Vacant for Rent Units: 1995-2016That is a greater weight that core good or core services (excluding rent). Rents account for 15% of the core PCE deflator, which the Fed targets, and helps explain the discrepancy between the two measures. |
There are other measures of rent, including rent on primary residences. However, what is important is the trend.

