The Census Bureau today released its advanced estimates for March trade. These include, among other accounts like imports and exports, preliminary results reported by retailers and wholesalers. That means, for our purposes, inventories. Oh my, was there ever more inventory. It was, apparently, widely expected that following an avalanche of goods building up over the previous five months the situation might calm down a touch. Analysts had figured wholesale inventories, to start with, might have gone up 0.9% from February to March after having surged 2.5% January to February. No sir. On the contrary, wholesale inventories jumped again, another 2.3% month-over-month during March. . And that was on top of a slightly higher revised estimate for February. Retail
Topics:
Jeffrey P. Snider considers the following as important: 5.) Alhambra Investments, bonds, Consumer Prices, CPI, currencies, economy, Featured, Federal Reserve/Monetary Policy, Inventory, Markets, newsletter, wholesale inventory
This could be interesting, too:
Nachrichten Ticker - www.finanzen.ch writes Die Performance der Kryptowährungen in KW 9: Das hat sich bei Bitcoin, Ether & Co. getan
Nachrichten Ticker - www.finanzen.ch writes Wer verbirgt sich hinter der Ethereum-Technologie?
Martin Hartmann writes Eine Analyse nach den Lehren von Milton Friedman
Marc Chandler writes March 2025 Monthly
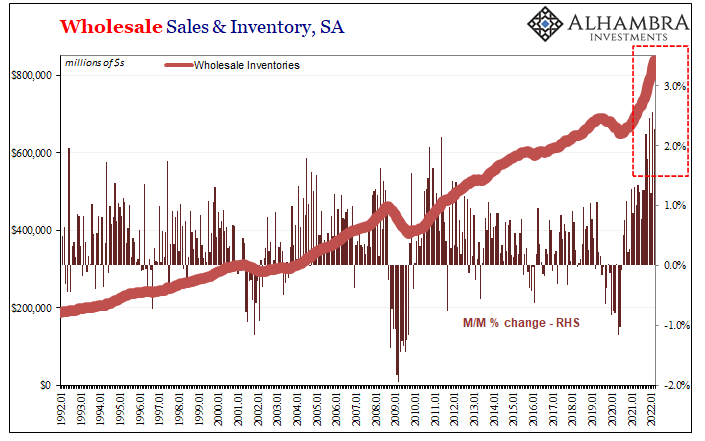
| The Census Bureau today released its advanced estimates for March trade. These include, among other accounts like imports and exports, preliminary results reported by retailers and wholesalers. That means, for our purposes, inventories.
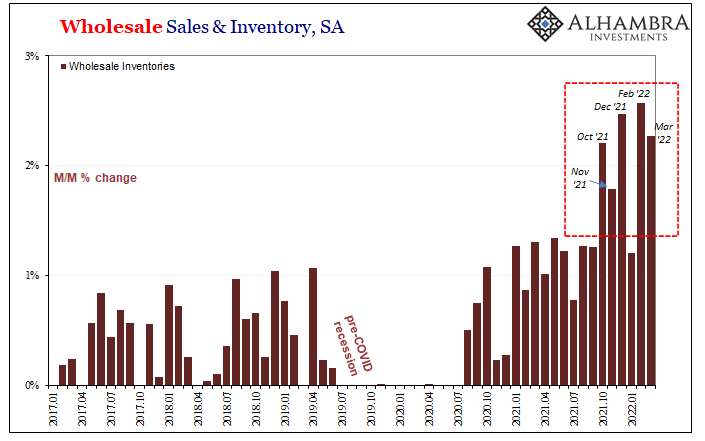
Oh my, was there ever more inventory. It was, apparently, widely expected that following an avalanche of goods building up over the previous five months the situation might calm down a touch. Analysts had figured wholesale inventories, to start with, might have gone up 0.9% from February to March after having surged 2.5% January to February. No sir. On the contrary, wholesale inventories jumped again, another 2.3% month-over-month during March. |
|
| And that was on top of a slightly higher revised estimate for February.
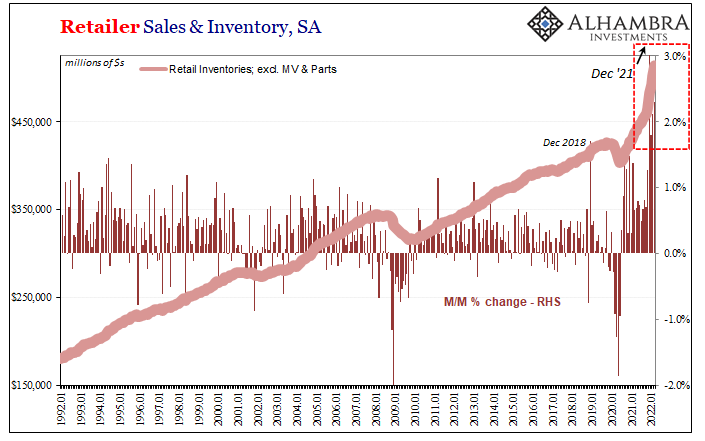
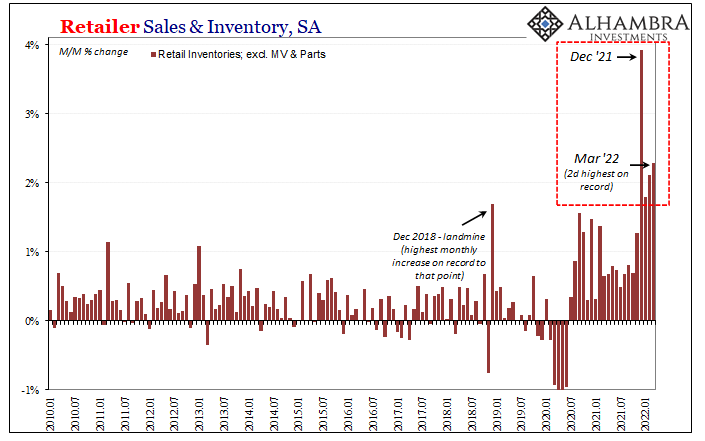
Retail inventories (excluding automobiles and parts) were thought to have maybe added 0.5% last month. Census today says it was another blockbuster, also up an enormous, historic 2.3% month-over-month. |
|
| These results are just as staggering as they at first appear. Only once, back in May 2011, had wholesale inventories increased by more than 2% in any single month. It has now happened four more times in just the last six (and November was close to the same threshold, nearly making five).
March’s 2.3% was the second highest on record, behind only February’s revised, meaning two in a row at rates never before seen. The situation is even more remarkable in retail. The largest prior single-month gain had been December 2018’s. This has since been surpassed by every single month since December 2021’s whopper; make it now four straight surpassing the prior record high. |
|
| On an annual basis, wholesale inventories are up 21.2% while retailer inventories (still not counting motor vehicles) surged 17.5%.
Yet, those figures also coincide with some of the largest price changes in recent memory. This naturally raises the question, is it all just price increases? Has the inventory side of the goods economy been hit by the same price illusion creating confusion all around the same segment of the global economy? Buy more get less would, in this context, suggest less physical inventory that just costs more. Less a problem of space and perhaps sales, though still uncomfortable when it comes to working capital. The qualified answer is, yes, the illusion has definitely goosed the inventory numbers which are estimated by value rather than volume. However, the values are largely at cost rather retail, meaning it isn’t clear by how much. |
|
| To try to get to the bottom of everything, I simply deflated the inventory estimates by the CPI since the CPI has risen higher and faster than the PCE Deflator (and using the PPI is further in the direction of oranges rather than the apples we seek). You can argue that neither are consistent with our purpose, and that’s fair, though I believe they’re close enough since that kind of precision is unnecessary; as you’ll see.
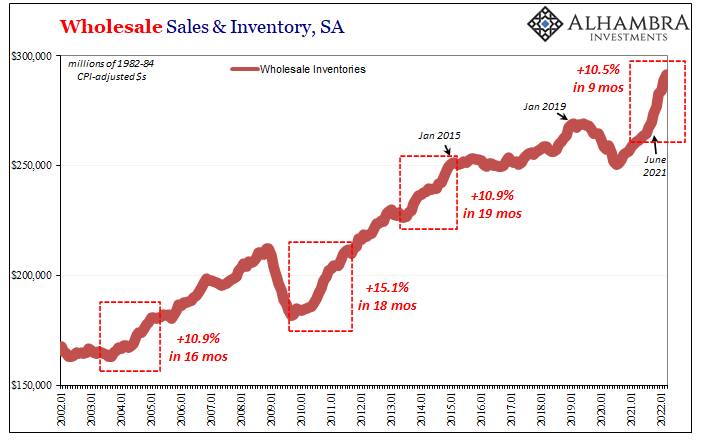
Broad strokes, the deflated inventory numbers absolutely show that while price changes have boosted the values, there is almost certainly an underlying buildup of physical supply, too. Let’s start with the wholesale level of the supply chain. According to my back-of-the-envelope deflating, inventories here gained 10.5% in constant 1982-84 dollar terms starting July last year and including the latest estimate for March. This is, by far, the quickest “volume” inventory expansion in the series. It compares in absolute terms to both Reflation #2 (up to January 2015) as well as when the economy finally started to recover in 2003 following the dot-com recession in 2001; all three around 11%. However, to reach the same level of CPI-adjusted increase, it took wholesalers far longer in both those previous time periods. The same held true for Reflation #1, the initial period following the Great “Recession” (Euro$ #1). Though the relative buildup ended up being larger, it also took much longer to get there. Thus, there is some precedence for the size of the inventory rebuild on the wholesale level, yet when accounting for pace there really isn’t. |
|
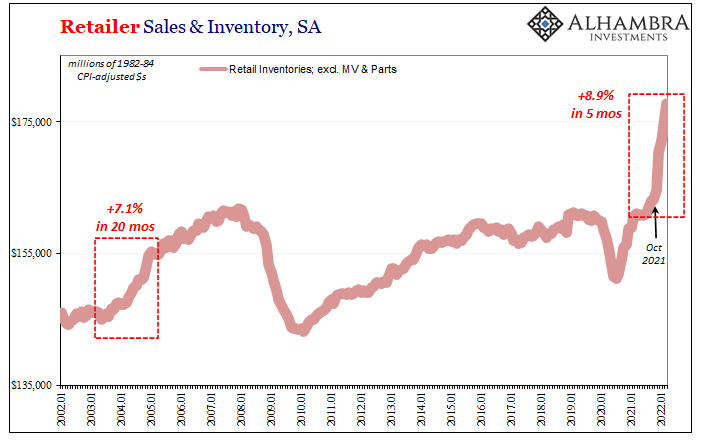
| Retailers have put themselves into a clear other category; just look at the chart above. You could already tell even by the value estimates provided from Census that what’s been going on is unusual. Further taking account of the CPI and that doesn’t change.
The closest comparison is from the same 2003-05 period. Back then, deflated retail inventories (ex MVs) gained 7.1% during that recovery’s restocking phase, one that stretched a relatively reasonable 20 months across calendars. This current restocking added significantly more at 8.9%, and then did so in just five months.And retailers have been much more averse to inventory builds than wholesalers. What this shows is that there’s every chance what is really happening in the goods economy is every bit as it seems. |
Prices are way up, sure, and so are volumes. The stuff that was over-ordered last year over fears of never-ending supply and transport snafus has indeed been flooding into the country at both the wholesale and retail levels in extraordinary fashion.
Going outside of Census inventory estimates, here’s more confirmation:
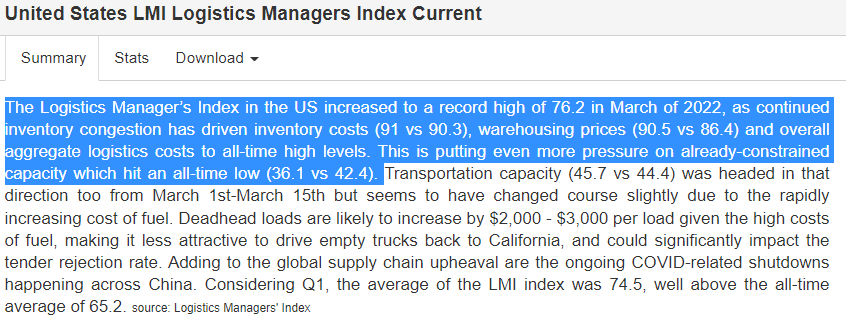
The Logistics Manager’s Index in the US increased to a record high of 76.2 in March of 2022, as continued inventory congestion has driven inventory costs (91 vs 90.3), warehousing prices (90.5 vs 86.4) and overall aggregate logistics costs to all-time high levels. This is putting even more pressure on already-constrained capacity which hit an all-time low (36.1 vs 42.4).
What happens to all this yet-unsold stuff floating around the US economy rather than stuck at port as many were thinking? If sales keep up, then maybe nothing. But even in that Reflation #3 example, what followed was a widely accepted “manufacturing recession” that culminated too closely in a near full-blown recession by early 2016.
Should sales soften in 2022, more than they have especially in like real terms, that’s where the bullwhip comes into play. And this time inventories are, as noted, far more than anything seen before, especially at retailers.
If it does happen, the FOMC’s rate hikes would quickly be revealed as totally unnecessary.
Tags: Bonds,Consumer Prices,CPI,currencies,economy,Featured,Federal Reserve/Monetary Policy,Inventory,Markets,newsletter,wholesale inventory

