In our July 29 post titled How Gold Stacks Up Against Stocks, Property, Commodities and Big Macs! we showed readers charts of gold as a ratio to other assets and products. We discussed that gold competes with crypto and stocks for the investment dollars. It was clear that gold as a ratio of the S&P 500 Index and of the broader MCSI World Equity Index show that gold is ‘relatively cheap’ compared to these measures. But then we showed that this wasn’t the case when we looked at the long run ratio of gold to other assets and products. Examples we used where wheat prices, UK house prices, oil prices, and the price of Big Macs. The ‘relatively cheap’ ratio of gold to the two equity market indices said another way is that these indices have risen or
Topics:
Stephen Flood considers the following as important: 6a.) GoldCore, 6a) Gold & Monetary Metals, Central Banks, Commentary, commodities, Commodity inflation, commodity news, commodity prices, commodity stocks, comparison charts, Economics, equity indices, Featured, Financial crisis, Financial News, Gold, gold price charts, gold price investing, gold price prediction, gold ratio, gold trading, inflation, investing in gold, News, newsletter, Precious Metals, Property, Stock markets, stock trading, stocks, Stocks & Commodities- A Complicated Correlation+, Stocks & Commodities- A Complicated Correlation+, taper tantrum, trading charts
This could be interesting, too:
finews.ch writes Franken-Stablecoin-Vereinigung setzt Beirat ein
finews.ch writes Die stille Supermacht: Warum Indien für Investoren zunehmend relevant wird
finews.ch writes Spezielle Premiere an der Schweizer Börse
finews.ch writes Mehr Schweiz: AllianzGI macht den nächsten grossen Schritt
In our July 29 post titled How Gold Stacks Up Against Stocks, Property, Commodities and Big Macs! we showed readers charts of gold as a ratio to other assets and products. We discussed that gold competes with crypto and stocks for the investment dollars.
It was clear that gold as a ratio of the S&P 500 Index and of the broader MCSI World Equity Index show that gold is ‘relatively cheap’ compared to these measures.
But then we showed that this wasn’t the case when we looked at the long run ratio of gold to other assets and products. Examples we used where wheat prices, UK house prices, oil prices, and the price of Big Macs.
The ‘relatively cheap’ ratio of gold to the two equity market indices said another way is that these indices have risen or outperformed gold in recent years.
What on Earth is Going on with Silver?
Watch Patrick Karim on GoldCore TV
Gold V/S Other Asset Classes
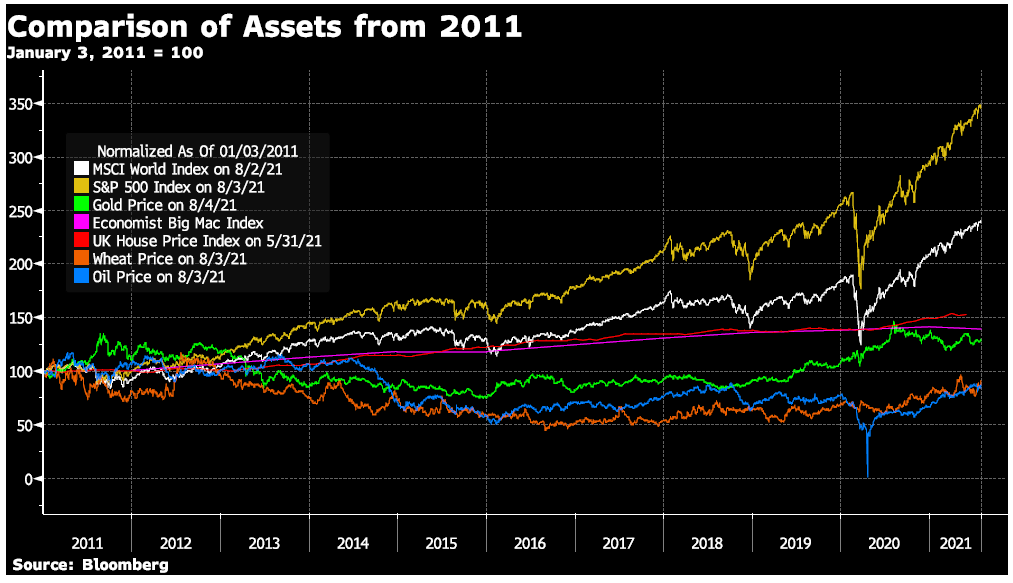
This week we explore the recent outperformance of these equity indices by charting the same asset classes as we showed as ratios to the gold price all normalized to 100. Using the beginning of the calendar year when the tops and bottoms of the ratio occurred as starting points.
By normalizing assets to the same starting point we can easily see how much each of these assets has gained since that starting point.
We start with the most recent turning point in the ratio, which occurred in 2011. This is when gold reached its cyclical high. It is important to remember that this was at the end of The Great Financial Crisis.
A period when no one could get loans because banks were failing. A recession meant huge job losses and governments were trying to prevent the possible depression.
This period marks the beginning of the massive central bank quantitative easing (central banks purchasing assets in the market) that has become common place today. People understood that financial assets driven by underlying debt were not as ‘safe’ as originally thought.
In the 2 years from 2011 until the beginning of 2013, both the stock market indices noted above were in line with other assets. Moreover, gold prices continued to outperform other assets.
Since gold is the investment people choose when they are fearful this 2011 until 2013 period makes total sense. As markets were still on edge from the massive declines experienced two years earlier.
Investment in gold does not require any company to pay dividends nor does it require global economic growth like equity markets, oil, and wheat require.
Taper Tantrum and its Aftermath
2013 is the key year on this chart. In that year we see that investors lost their fear and returned to equities. Gold fell behind the MSCI World Index, it fell behind the SP500, and it fell behind oil.
Something else happened in 2013 which was crucial. After what is commonly referred to as the ‘taper tantrum’, when central banks namely the US Federal Reserve discussed removing the easy monetary policy from markets yields rose sharply (and gold declined).
Central banks reacted by essentially making emergency stimulus into permanent stimulus which continues today. Most people call it quantitative easing, others call it money printing.
As a result, the S&P 500 and MSCI World indices pulled away from not only gold but from all the other assets charted including oil and house prices. For us, this proves the key insight that central bank stimulus finds its way into asset classes that readily accept margin loans and leverage.
Oil is harder to invest in than stocks, as is gold. Because Big Macs and housing are harder to leverage than gold, oil. And stocks, have not been able to accelerate the slow growth shown from 2011 until 2013. And remember that this was also a period of slower economic growth in advanced economies and lower inflation as measured by official consumer price measures than before The Great Financial Crisis.
This means that ‘financialization’ is the huge hidden force in the current outperformance of equity indices since 2013. To wit, it is the ability to use borrowed money at cheap interest rates. Driving stocks to outperform gold in a way that oil and Big Macs cannot match.
Download Your Free Guide

Therefore, the biggest risk in our financial system today is excessive debt, and that debt has at least two consequences:
A) gold would be higher against stock markets except for the global accumulations of debt, fueled by low interest rates and central bank money printing,
B) should the debt flow ever stop then the outperformance of stocks will reverse and
C) the opportunity for safety against A and B can be found in owning other low levered things such as commodities and private businesses.
To put this in perspective we present below the same asset classes on charts with starting points of 1970, 1980, and 2000. All charted through the latest data available in 2021.
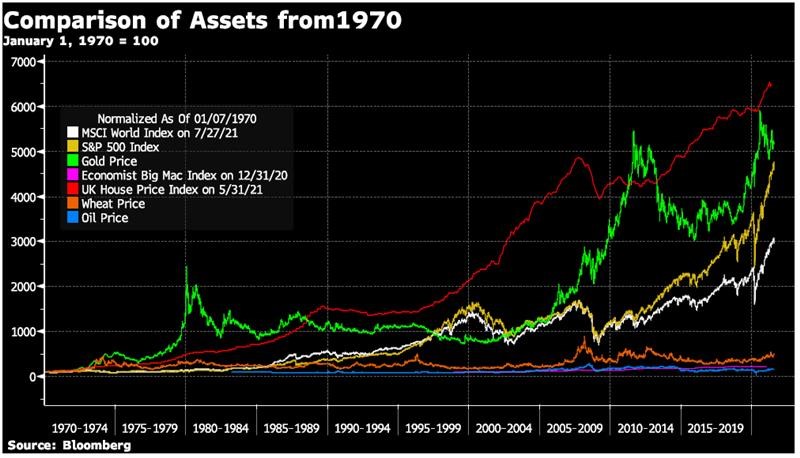
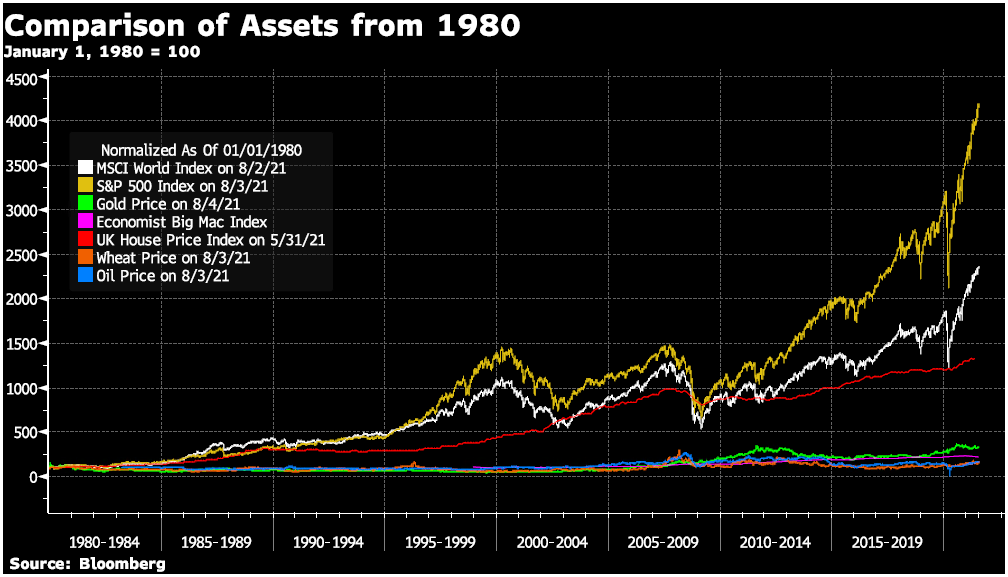
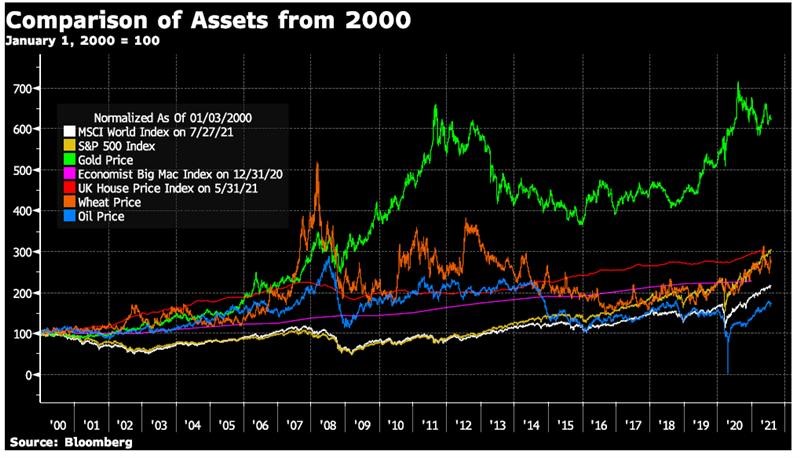
As discussed above, these represent the remainder of the turning points in the ratio of gold to the S&P 500 and MCSI World Equity Indices.
When all the assets are normalized back to 1970, of the assets charted, UK house prices have outperformed all other asset classes, followed by gold.
The key lesson to learn from studying these longer-term charts is that nothing outperforms forever. With that in mind, we remain confident the leverage landscape will someday change in a fashion that punishes equities for the betterment of precious metals.
And the time to buy is when the ratio is ‘relatively cheap’ compared to equity markets.
Is Gold Still in a Bull Market?
Watch Gareth Soloway on GoldCore TV
From the Trading Desk
Stock Update:
Excellent stock and availability on all gold coins and bars.
British Gold Sovereigns, we still have a limited number available at spot plus 5.25%.
Please call our trading desk to avail of this offer. Gold Britannia’s 1oz coins start at 6.5% over spot.
The Lowest premium on gold is on the 1oz bar at a very competitive 3.75% over Spot.
Gold Krugerrands are currently the lowest premium on 1oz coins at spot plus 5.5%.
Silver Coins are available for storage or delivery.
Silver coins are significantly cheaper when purchased for storage in Zurich as they can be purchased VAT Free. We have excellent availability at the moment.
Silver 100oz and 1000oz bars are also available VAT-free in Zurich.
**We currently have a limited number of silver 1000oz bars at spot plus 7%**.
Please call our trading desk to avail of this offer.
Please see below our extended trading hours.
** We have extended our opening hours. Phone lines, online ordering and WebChat are now open until 09:00-22:00 (Europe/Dublin) USA 09:00 to 17:00 EST**
Market Update:
Gold prices moved higher on Wednesday morning on the back of the weak private payrolls number, employers added 330,000 positions for the month which was far weaker than June at 680,000 and well below estimates at 653,000.
The early gains were given back with the stronger than expected ISM services report which came out later in the day.
All eyes now move to Friday’s U.S nonfarm payroll data for the July employment report.
The expectation is to see an increase by 880,000 following from June rise of 850,000, according to a Reuters survey of economists.
The importance of these numbers again comes back to tapering and what the Fed will do next.
Powell last week said the job market still had ‘some ground to cover’ before it could pull back its support for the economy.
However, two more hawkish policymakers said in recent days they believed the job market recovering is nearing completion.
Buy Gold Coins
GOLD PRICES (USD, GBP & EUR – AM/ PM LBMA Fix)
04-08-2021 1812.45 1829.10 1301.34 1311.83 1528.44 1538.82
03-08-2021 1809.70 1812.65 1300.81 1305.11 1523.04 1527.16
02-08-2021 1807.55 1811.45 1298.36 1302.61 1521.05 1524.34
30-07-2021 1828.25 1825.75 1307.75 1308.52 1535.73 1536.92
29-07-2021 1819.45 1829.30 1304.00 1309.05 1532.16 1539.54
28-07-2021 1799.30 1796.60 1296.04 1297.15 1522.03 1524.24
27-07-2021 1797.15 1800.35 1302.75 1302.91 1525.06 1524.00
26-07-2021 1808.15 1800.20 1311.63 1302.80 1533.13 1524.77
23-07-2021 1803.05 1799.60 1313.34 1308.67 1532.77 1529.84
22-07-2021 1797.40 1799.45 1308.51 1307.12 1523.84 1523.05
Buy gold coins and bars and store them in the safest vaults in Switzerland, London or Singapore with GoldCore.
The post Gold, Stocks & Commodities- A Complicated Correlation appeared first on GoldCore Gold Bullion Dealer.
Tags: central-banks,Commentary,commodities,Commodity inflation,commodity news,commodity prices,commodity stocks,comparison charts,Economics,equity indices,Featured,Financial crisis,financial news,Gold,gold price charts,gold price investing,gold price prediction,gold ratio,gold trading,inflation,investing in gold,News,newsletter,Precious Metals,Property,Stock markets,stock trading,stocks,Stocks & Commodities- A Complicated Correlation+,taper tantrum,trading charts


