We apologize for not posting articles during January. We have been busy, and going forward will publish a separate Market Report every Monday morning plus macroeconomics essays later in the week, as time permits. This is our annual analysis of the gold and silver markets. We look at the market players, dynamics, fallacies, drivers, and finally give our predictions for the prices of the metals over the coming year. Introduction Predicting the likely path of the prices of the metals in the near term is easy. Just look at the fundamentals. We calculate the gold fundamental price and the silver fundamental price (methodology described below) every day, and our data series goes back to 1996. Here is a graph showing the gold fundamental for three years. Gold
Topics:
Keith Weiner considers the following as important: 6a.) Keith Weiner on Monetary Metals, 6a) Gold & Bitcoin, Basic Reports, Featured, gold manipulation, gold market, gold price, Interest rates, newsletter, ted butler
This could be interesting, too:
Nachrichten Ticker - www.finanzen.ch writes Die Performance der Kryptowährungen in KW 9: Das hat sich bei Bitcoin, Ether & Co. getan
Nachrichten Ticker - www.finanzen.ch writes Wer verbirgt sich hinter der Ethereum-Technologie?
Martin Hartmann writes Eine Analyse nach den Lehren von Milton Friedman
Marc Chandler writes March 2025 Monthly
| We apologize for not posting articles during January. We have been busy, and going forward will publish a separate Market Report every Monday morning plus macroeconomics essays later in the week, as time permits.
This is our annual analysis of the gold and silver markets. We look at the market players, dynamics, fallacies, drivers, and finally give our predictions for the prices of the metals over the coming year. |
|
IntroductionPredicting the likely path of the prices of the metals in the near term is easy. Just look at the fundamentals. We calculate the gold fundamental price and the silver fundamental price (methodology described below) every day, and our data series goes back to 1996. Here is a graph showing the gold fundamental for three years. |
Gold Fundamental Price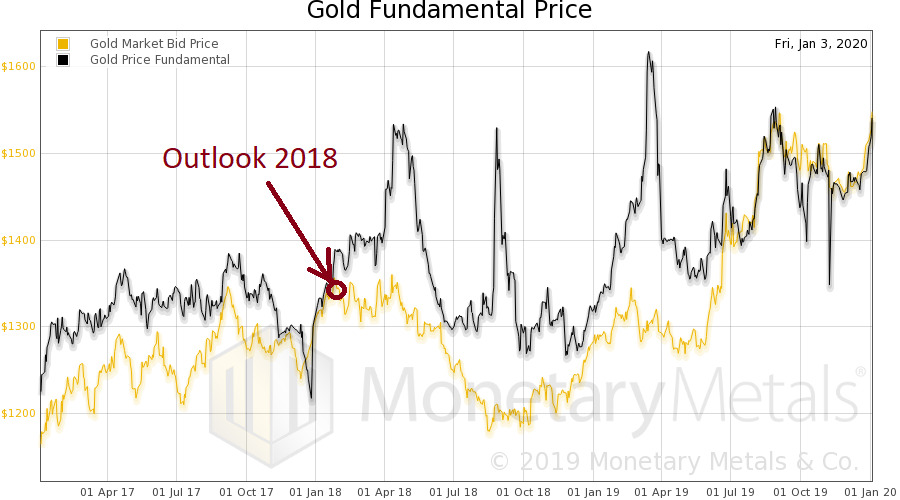 - Click to enlarge |
| We circled the date of our Outlook 2018 (we skipped last year). At that time, we called for the price to hit $1,450 by the end of the year. We were right about the fundamentals, and the price did eventually meet and exceed our call. Though about six months late.
Of course, the market price can diverge from the fundamental price, sometimes by a sizeable percentage and sometimes for a long period of time. And it tends to converge again sooner or later. As of year’s end 2019, the market and the fundamental prices were less than ten bucks apart. How far can they deviate? In the last decade, the peak discount has been over 25%. Predicting the price farther out is much harder. The fundamental shows the relative pressures in the spot and futures markets, but only shows a snapshot. It does not predict how those pressures might change. For that, one looks at the dollar of course, credit, interest rates, other currencies, the economy, and even wild cards like bitcoin. In fourth grade math class, Miss Jennifer didn’t want the kids to just write “42” (with due respect to Douglas Adams). She wants to see the work all written out. It’s not so valuable if we say “silver to $10” (or $100”), without saying why. |
Gold Prem/Disc percent to Fundamental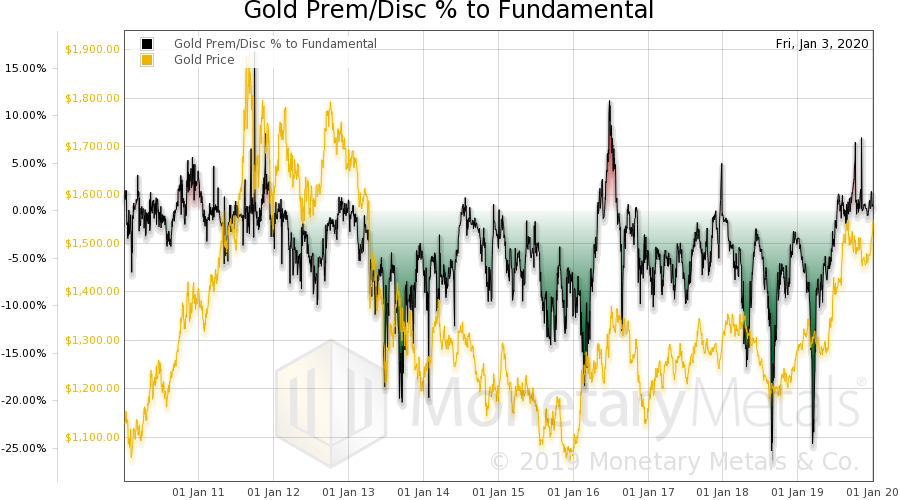 - Click to enlarge |
Below, we will show our “long division” work before getting to our bottom line numbers.
How Not to Think about GoldIt may seem odd to begin by discussing how not to do it. |
Gold Roll Costs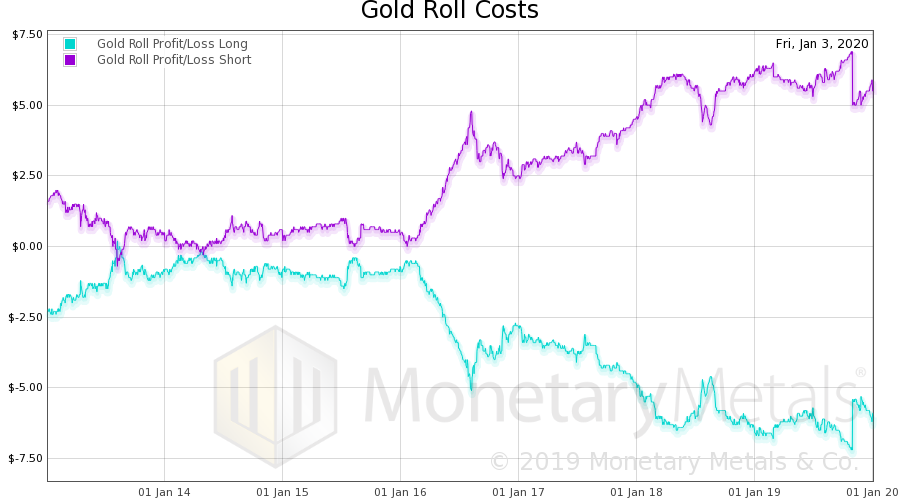 - Click to enlarge |
| However, these approaches are very common and many people start with one of these approaches, such as price manipulation conspiracy theories, rumors, out-of-context-factoids, or mining production and manufacturing consumption data.
We have lost track of the number of prominent people who have published a hard date for some catastrophe to occur. These dates have all come and gone (we have been watching this page reschedule Armageddon every six months for years—it was just recently slated for Dec 31, but now postponed to June). Some of these guys have predicted dozens of the last zero hyperinflations. Despite their efforts, the dollar is still intact. Our view is that the dollar is indeed dying, but it is not via the white hot thermonuclear blast of hyperinflation. It is by the cold drowning when even a strong swimmer, exhausted, sinks below the waves at sea. It is not going to die when “the sheeple wake up,” or due to some meeting of the G20, or a declaration of the IMF that the dollar’s reserve status is gone. That is not how it works. These approaches are unhelpful. They can confuse long-term holders, and lead traders to make costly mistakes. We have written a lot to debunk claims of price manipulation (here is our open letter to Ted Butler, which has so far not been answered by him or anyone else. Broadly, conspiracy theories fall into a few categories. One, central banks are selling gold. Maybe, but what explains the even-larger price drop in silver since 2011? The banks don’t have any silver. So if gold was manipulated by central bank selling of metal, then silver should show us what a not-manipulated price looks like. And the gold-silver ratio would be closer to 10 than to 100. Two, banks are short-selling futures naked. This would cause backwardation. It would also cause expiring contracts to move in the opposite direction than they actually do. When each contract expires, someone who is naked short would have to buy it with urgency. If there were really a massive naked short position, there would be a buying frenzy and the expiring contract would be bid up higher relative to the spot price. The basis would rise. The reality—and we show a graph of every expiring contract back to 1996 in our response to Mr. Butler—is the opposite. Falling basis. Three is just what we have to call magical thinking. For example the bigger a trader’s position, the more he controls the price. How’s that supposed to work? We would put rumors, Indian gold import numbers, and news into the same bucket. Even when factual, these items are the investing world’s equivalent of an attractive nuisance—they can lure you to financial harm. Most importantly, one should never trade based on what the Fed has done (increase the quantity of dollars) is doing (increase it) or will do (increase it some more). That is not what drives the gold price. Finally, we come to the numbers for electronics and jewelry consumption, and mine production. We firmly insist that gold and silver cannot be understood by looking at small changes in production or consumption. The monetary metals cannot be understood by conventional commodity analysis. This is because virtually all of the gold ever mined in human history is still in human hands (to a lesser extent for silver). No other commodity comes even remotely close. The World Gold Council estimated the total gold stocks at 188,538 metric tons at the end of 2017. We believe this understates the reality, perhaps by a large multiple. People have been hiding gold from their acquisitive governments and neighbors for thousands of years. Gold has always been the sort of thing that most people would rather keep quiet about. It defies any systematic inventorying process. In any case, annual production is a tiny fraction of even this conservative number. The World Gold Council reported mine production has averaged 3,247 tonnes over the past three years. This is just 1.7% of then-existing stocks. In other words, it would take 58 years at current production levels just to produce the same amount of gold as is now stockpiled. In regular commodities, this same ratio—stocks to flows—is measured in months. We just don’t hoard wheat and oil for the long term, for obvious reasons. Nor even iron or lumber or other durable materials. If total gold mining is 1.7% of gold inventories, then small changes within that 1.7% are not likely to have much impact on the gold price. How We Think About GoldThe implications of this are extraordinary. All of that stockpiled gold represents potential supply, under the right market conditions and at the right price. Conversely—unlike ordinary commodities—virtually everyone on the planet represents potential demand. If someone offered to pay you 1,000 barrels of oil, where would you put it? The same value of gold could fit in your pocket. A change in the desire to hoard or dishoard gold, even a small one, can have a big impact on price. There is no such thing as a glut in gold. Through rising and falling prices over thousands of years, the market goes on absorbing whatever the miners put out. Gold mining does not collapse the gold price, as oil drilling or copper mining does, when inventories accumulate. The whole point of gold is that inventories have been accumulating at least since the time of the ancient Egyptian Empire. Why would people be willing—not just today, in the wake of the great financial crisis of 2008 and unconventional central bank response, but for thousands of years—go on accumulating gold and silver? There is only one conceivable answer. It’s because these metals are money. Compare gold to oil. The marginal utility of oil—the value one places on the next barrel compared to the previous—declines rapidly. For oil, it falls rapidly because once your tank is full, you have that storage problem—assuming you even directly use oil at all. People are happy to get the 1,001st ounce, and accept it on the same terms as the 1,000th or the 1st ounce. It doesn’t hurt that you could carry those 1000 ounces in a backpack, nor that you can find a ready market for it anywhere in the world, from London to Lisbon to Lagos to LA to Lima to Laos. So if gold is money, then what’s the dollar? The dollar is a small slice of the US government’s debt. It is a promise to pay, though it comes with a disclaimer that says the promise will never be honored. The dollar is credit, whose quality is falling. What does that mean for our discussion of the gold price? It turns it inside out. We don’t look at it as most people do, that gold is worth $1,550. This is backwards, upside down, and inside out. It is like saying your meter stick is 143 gummy bears long (actually, gummy bear is an interesting analogy for the dollar: it’s sweet but not satisfying, rubbery and hence indeterminate in length). Instead, we insist that the dollar is worth 20 milligrams of gold. This is not merely semantics. It is a paradigm shift—easy to say, but harder to get your head around. The advantage of this perspective is that you can see the market much more clearly. If you are in a rowboat, tossing about in stormy seas, would you say the lighthouse is going up and down? If you have rubbery gummy bears would you use them to measure a steel meter stick? Can you say that the steel is getting shorter, as the candy compresses? No, the lighthouse and steel are stable but the waves and rubber band are not. When you say “gold is going up”, you can’t help but think you are making a profit. But if you say “the dollar is dropping” then you realize the truth. Sure the gold owner may have more dollars, but those dollars are worth less than they were. He should not be so tempted to spend down his gold savings, merely because the value of the dollar fell. The harm of spending one’s capital, of consuming one’s wealth, is a persistent them across our writings. You cannot profit merely by holding gold. You can avoid losses (which is a good thing, of course). We go further. We encourage everyone to calculate his net worth in gold, and measure profit or loss based on gains or losses in gold ounces. If you had 100oz and later you have 110oz, then you got richer. If you went down to 99oz—even if the price of gold is higher, and your gold is worth more dollars—you have suffered a loss. We encourage you to get into the discipline of dividing your dollar net worth amount by the then-current price of gold. Keep a record and track it every month or every quarter. You can profit from holding silver, when silver goes up. We don’t mean its price in dollars, but in gold. For example, if the silver price begins at 400mg gold and it rises to 600mg, then you have made a profit of 200mg or 50%. It is about 360mg right now, and it was last at 600mg in 2012. You can sometimes profit by going long the dollar. It is declining in a century-long downtrend, but that doesn’t mean there aren’t corrections along the way. For example, the dollar hit a low of 16mg gold in 2011. After that, its rally was impressive. Even with the recent decreases in its price, it’s still up 25% from that all-time low. At other times, you can profit by shorting the dollar with leverage, for example buying gold futures on margin. Suppose you have 100oz gold, or about $155,000 today. You need $4,950 cash to open a futures contract position. $155,000 enables you to buy 31 100oz contracts. In other words, futures offer 31:1 leverage. If the price of gold goes up $46.50, or 3%, then you profit $144,150 or 93oz gold. Not bad on a bet of 100oz, though of course the risk is extreme with leverage this extreme. As they say on those shows on TV when they blow up stuff with dynamite, “now kids, don’t try this at home”. How We Analyze the Gold MarketWe think of the market as the coming together of 5 different primary groups: buyers of metal, sellers of metal, buyers of paper, short sellers of paper, and market makers. It’s important to keep in mind that virtually all of the gold ever mined is in someone’s hoard. There is no such thing as a glut or shortage. However, the market can experience relative abundance and scarcity and the spreads of the warehouseman provide a good signal to see it. If there is a big spread between spot and futures—called the basis—then this means two things. One, speculators are bidding up futures contracts. And two, the marginal use of gold is to go into the warehouse. This is a sign that gold is abundant to the market. Normally, the price in the futures market is higher than the price in the spot market. This is called contango. Contango means it is profitable to carry the metal, which is to buy a metal bar and sell a future against it. However, the basis spread can invert and it has many times since the crisis of 2008. When it is inverted—called backwardation—it is profitable to sell metal and buy a future. Such decarrying is, by conventional standards, risk free (it’s not, see below). It should never happen in gold, as it is a sign of shortage and there is no such thing as a shortage in a metal which has been hoarded for millennia. Backwardation is a signal to the warehouseman to empty out the warehouse. In backwardation, the marginal supply of metal is coming from the warehouse (carry trades are unwinding). Obviously, there is only a finite supply of gold held in carry. Thus, backwardation presages rising price. This is the only way to analyze supply and demand fundamentals for the monetary metals. They are not consumed, and only accumulate over time. They have a stocks to flows (i.e. inventory divided by annual mine output) ratio measured in decades. As they’re not bought to consume there is no particular price ceiling. The five market participants interact to form a constantly changing dynamic. It is this dynamic that we study when we look at spreads between spot and futures, and changes to these spreads. Monetary Metals has developed a proprietary model based on this theory, which outputs the Fundamental Price for each metal. This is updated every day. We have published more on the theory. Macroeconomic ConditionsAs of the last writing of this annual market outlook, it was common belief that we are in for a period of rising prices and interest rates. We didn’t agree then, and we don’t agree now. The idea of rising rates is a bit less popular, now that the Fed has reversed itself and (so far) cut the effective Fed Funds rate by 80bps. One call in 2018 that we got absolutely right: “Something has to give. Or several somethings. We believe one thing that gives will be interest rates. They cannot rise very far, or durably.” Not the Drivers of the Big Price MoveSpeculators view gold and especially silver as just a vehicle to ride, to make more dollars. They can pull the price pretty far, at least for a while. Like stretching a big rubber band however, it gets exhausting to keep up the force. Eventually if they’ve gotten the trend wrong, they must let go. At some point, fatigue sets in (not to mention the cost of the keeping and rolling a futures position). Here is a graph of the cost of rolling a futures contract, showing seven years. For long positions, look at the cyan line which is negative. For quite a while, it cost almost nothing to roll each futures contract, around 50 cents. But starting about two years ago, the cost went up. It is now over $6. A speculator had better expect a big price move, to be willing to pay that cost at each contract roll (six time a year). |
|
Our NumbersGold closed the year 2019 at $1,517 and the Monetary Metals gold fundamental price was just a few bucks below that. Silver closed at $17.82. The Monetary Metals silver fundamental price closed a few pennies under that. As with gold, the fundamental price rose this year. In silver, the increase is about 10%. Fundamentals can and do change. So what do we expect this year? Retail vs.Institutional Buying The price of gold shot up roughly June through August. At the end of May, gold traded for about $1,300. By the end of August, it was well over $1,500. During this period, there was no change in the gold basis. See this chart showing mid-May to mid-September. It shows not the price of gold in dollars, but the price of the dollar in gold (which is inverse). There is a big drop, from 24.3mg gold to 20.3mg, or about 16.5%. |
Gold Basis and Co-basis and the Dollar Price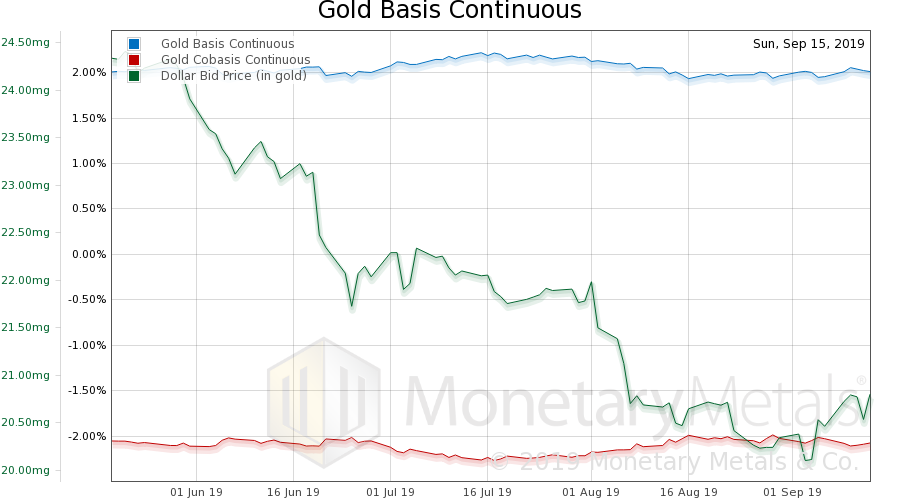 - Click to enlarge |
Rising price of gold without rising basis means the move was driven by the buying of metal, not of futures. This was fundamental buying, not leveraged speculation.
Yet, by all accounts, dealers were getting customer sell-backs. The price moved up, against retail selling. If it was not driven by futures speculators, then that leaves only institutional investors. We can say that we are seeing institutional interest in gold in a different way than we have seen since 2012. However, we don’t prefer to make arguments based on un-referenceable conversations (data provided in the full article).
The proof is in the pudding: we have rising price, flat basis, and retail selling. If there is another theory that explains these three observations, we are all ears.
Our Call
From the crisis through 2011, the prices of the metals ran up due to the inflation trade: “Oh my God, they are printing money to infinity! Buy gold and silver before they go to the moon!”
Then, that trend ended. The next several years were a period of despair alternating with hope as the prices of the metals fell and fell, and then rallied. It took from August 2011 when the price of gold hits its peak just under $2,000 until December 2015, when the price hit its trough a bit over half that level.
Since then, we think most chartists would agree that the gold price is in an uptrend. But the question is: where to, from here?
The central banks have been fighting mightily to keep the current boom going. It has been going so long now, that it has to be a record length without a bust. We have been saying for many years that this requires the interest rate continue to drop. The Fed briefly tried to disagree, but has now been forced to concede. We believe that they are now in the position, known in the game of chess, as zugzwang…
Click here to read the full Outlook 2020, including our calls for the gold and silver prices (free subscription required).
© 2020 Monetary Metals LLC. All Rights Reserved.
Tags: Basic Reports,Featured,gold manipulation,gold market,gold price,Interest rates,newsletter,ted butler