Developed equity markets remain near the highs despite mounting concerns about the impact of the coronavirus MSCI World made a new all-time high last week near 2435 and is up 2.5% YTD Our 1-rated grouping (outperformers) for Q1 2020 consists of Ireland, Israel, New Zealand, Spain, and Switzerland Our 5-rated grouping (underperformers) for Q1 2020 consists of the Italy, Germany, Portugal, Japan, and Greece Since our last update on November 19, our proprietary DM equity portfolio has risen 6.9%, outperforming MSCI World (up 5.7%) DM EQUITY OUTLOOK Developed equity markets remain near the highs despite mounting concerns about the impact of the coronavirus. Things have turned 180 degrees since the year began, when the signing of the Phase One trade deal was expected
Topics:
Win Thin considers the following as important: 5.) Brown Brothers Harriman, 5) Global Macro, Articles, developed markets, Featured, newsletter
This could be interesting, too:
Nachrichten Ticker - www.finanzen.ch writes Die Performance der Kryptowährungen in KW 9: Das hat sich bei Bitcoin, Ether & Co. getan
Nachrichten Ticker - www.finanzen.ch writes Wer verbirgt sich hinter der Ethereum-Technologie?
Martin Hartmann writes Eine Analyse nach den Lehren von Milton Friedman
Marc Chandler writes March 2025 Monthly
- Developed equity markets remain near the highs despite mounting concerns about the impact of the coronavirus
- MSCI World made a new all-time high last week near 2435 and is up 2.5% YTD
- Our 1-rated grouping (outperformers) for Q1 2020 consists of Ireland, Israel, New Zealand, Spain, and Switzerland
- Our 5-rated grouping (underperformers) for Q1 2020 consists of the Italy, Germany, Portugal, Japan, and Greece
- Since our last update on November 19, our proprietary DM equity portfolio has risen 6.9%, outperforming MSCI World (up 5.7%)
DM EQUITY OUTLOOK
Developed equity markets remain near the highs despite mounting concerns about the impact of the coronavirus. Things have turned 180 degrees since the year began, when the signing of the Phase One trade deal was expected to lead to a synchronized pickup in global growth. Instead, the Chinese economy is slowing sharply, with knock-on effects to the rest of the world coming through the channels of trade, tourism, and supply chains. The major central banks remain in dovish mode, which adds a positive liquidity element to the equity story.
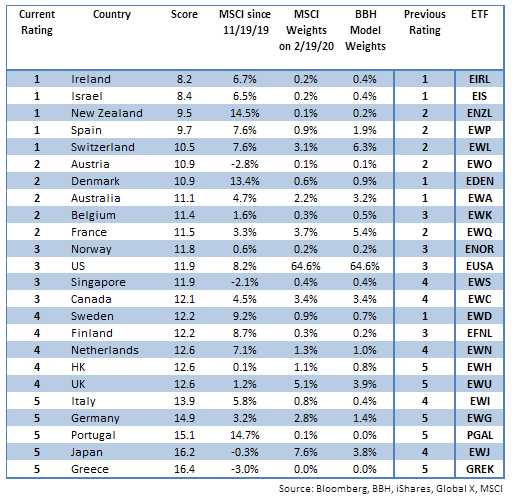
MSCI World made a new all-time high last week near 2435 and is up 2.6% YTD. This compares to -2.3% YTD for MSCI EM and represents the rare occasion where DM stocks outperform their EM counterparts. Within DM, the best performers YTD have been Portugal, Denmark, and New Zealand, while the worst have been Greece, Austria, and the UK. It’s worth noting that the correlation between EM and DM stocks is currently .635. Whilst below the September peak near .68, it is still relatively high and well above the low around 0.44 seen in December.
How can we reconcile elevated equity markets with the ongoing uncertainty regarding the coronavirus? Markets are clearly pricing in a V-shaped recovery, which has been typical for past viral outbreaks. We are going with this as a base case, though the situation is constantly changing. Unless we see signs that it will be more of an extended U-shaped recovery, we suspect equity markets are likely to hold up relatively well.
We believe it is very important for investors to continue focusing on country fundamentals. Which countries are most vulnerable to the coronavirus? Here, Asia is clearly getting the worst of it while North America is likely to be better insulated. Equity markets seem to agree. North America is the best equity performer so far in 2020 (4.7% YTD), followed by Europe (3.0% YTD) and then the Pacific (-3.4%). We think that if the coronavirus outlook worsens, Asia will underperform even more. Hedging out currency risk has also become more important for US investors as the strong dollar trend continues.
Our 1-rated grouping (outperformers) for Q1 2020 consists of Ireland, Israel, New Zealand, Spain, and Switzerland. New Zealand, Spain, and Switzerland all improved from 2 to 1, pushing Denmark and Australia down from 1 to 2. Belgium improved from 3 to 2, adding to the weight that pulled Sweden down from 1 to 4. We note that of the top 10 countries, 7 are in Europe, 2 are in Asia, and 1 is in the Middle East.
Our 5-rated grouping (underperformers) for Q1 2020 consists of the Italy, Germany, Portugal, Japan, and Greece. In a total reversal of last quarter, the UK and Hong Kong improved from 5 to 4, pushing Italy and Japan back down from 4 to 5. We note that of the bottom 10 countries, 8 are in Europe and 2 are in Asia. Other notable movements include Singapore and Canada both improving from 4 to 3, pushing Finland back down from 3 to 4.
| MODEL PERFORMANCE
Since our last update on November 19, our proprietary DM equity portfolio has risen 6.9%, outperforming MSCI World (up 5.7%). Overweighting Switzerland, Spain, and Sweden helped our return as these markets outperformed with relatively large weights. Elsewhere, underweighting Canada, the UK, Japan, and Germany helped our return as these markets underperformed with relatively large weights. What calls hurt our model return? Overweighting Australia and France hurt our return, as these markets underperformed with relatively large weights. Underweighting the Netherlands and Italy also hurt our return as these markets outperformed with relatively large weights. |
 . |
MODEL DESCRIPTION
Our equity allocation model is meant to assist global equity investors in assessing relative sovereign risk and optimal asset allocation across countries in the DM universe. The countries covered include all 23 of the countries in the MSCI World Index. We have also included Greece in this model. Even though MSCI puts the nation in MSCI EM, we continue to view it as DM.
A country’s score reflects its relative attractiveness for equity investors – the likelihood that its equity market will outperform the rest of our DM universe over the next three months. A country’s score is determined as a weighted composite of 15 economic and political indicators that are each ranked against the other 23 countries in our model DM universe. Categories are industrial production growth, real interest rates, export growth, expected P/E ratio, real bank lending, yield curve steepness, real money growth, GDP growth, investment/GDP, per capita GDP, inflation, retail sales, political risk (EIU), leading indicators, and ease of doing business (World Bank). A country that is typically ranked first in many of the categories will end up with a low composite score (the lower the better).
From a portfolio construction standpoint, we are benchmarking to MSCI World. As a result, our BBH model portfolio weights will be Underweight/Overweight compared to the MSCI weights.
- Countries that are rated 1 will have a BBH weight that is 2.0 X MSCI World weight.
- Countries that are rated 2 will have a BBH weight that is 1.5 X MSCI World weight.
- Countries that are rated 3 will have a BBH weight that is equal to MSCI World weight.
- Countries that are rated 4 will have a BBH weight that is 0.75 X MSCI World weight.
- Countries that are rated 5 will have a BBH weight that is 0.5 X MSCI World weight.
To have the BBH model portfolio weights add up to 100%, there may be some exceptions to the rules outlined above. However, we will always try to keep to these parameters as closely as possible.
CHANGE IN METHODOLOGY AND COVERAGE
In the past, we have taken a simple average of each grouping (1 through 5) to determine model performance. That allowed small markets to skew the results. We are now taking a weighted approach, with country returns weighted by the BBH model weightings. Then, we compare our model performance against the benchmark MSCI World.
Tags: Articles,developed markets,Featured,newsletter