The Bureau of Labor Statistics (BLS) has begun the process of updating its annual benchmarks. Actually, the process began last year and what’s happening now is that the government is releasing its findings to the public. Up first is the Household Survey, the less-watched, more volatile measure which comes at employment from the other direction. As the name implies, the BLS asks households who in them is working whereas the more closely scrutinized Establishment Survey queries establishments as to how many are on their payrolls. The benchmark update for the Household Survey was negligible. There were only minor alterations to the data in both directions, leaving the series for its January 2020 benchmark in much the same place it was leaving off from the January
Topics:
Jeffrey P. Snider considers the following as important: 5.) Alhambra Investments, Average Hourly Earnings, average weekly hours, benchmark revisions, BLS, currencies, economy, establishment survey, Featured, Federal Reserve/Monetary Policy, hours, hours worked, household survey, jay powell, jobs, jolts, Labor market, Markets, newsletter, payrolls, rate cuts, Recession, wages
This could be interesting, too:
Nachrichten Ticker - www.finanzen.ch writes Die Performance der Kryptowährungen in KW 9: Das hat sich bei Bitcoin, Ether & Co. getan
Nachrichten Ticker - www.finanzen.ch writes Wer verbirgt sich hinter der Ethereum-Technologie?
Martin Hartmann writes Eine Analyse nach den Lehren von Milton Friedman
Marc Chandler writes March 2025 Monthly
|
The Bureau of Labor Statistics (BLS) has begun the process of updating its annual benchmarks. Actually, the process began last year and what’s happening now is that the government is releasing its findings to the public. Up first is the Household Survey, the less-watched, more volatile measure which comes at employment from the other direction. As the name implies, the BLS asks households who in them is working whereas the more closely scrutinized Establishment Survey queries establishments as to how many are on their payrolls. The benchmark update for the Household Survey was negligible. There were only minor alterations to the data in both directions, leaving the series for its January 2020 benchmark in much the same place it was leaving off from the January 2019. |
Household Survey: Civilian Employment, 2017-2019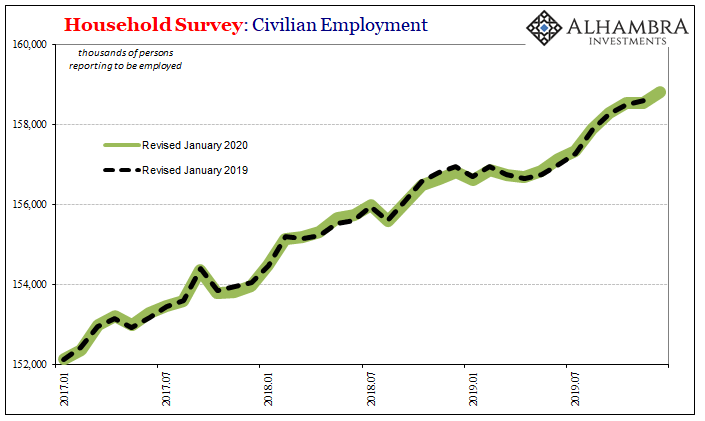 - Click to enlarge |
| We’ve known for months, however, that will not be the case for the Establishment Survey. Last year, the BLS’s preliminary assessment indicated that the changes will be substantial – in the wrong direction. The updated benchmark and data series will be released with next month’s payroll report.
This greatly diminishes the impact and relevance of the latest one, if each of them over recent months perhaps all of them going all the way back to March 2018. That’s what the benchmark assessment does – the BLS staff goes into state unemployment tax filings (a much more comprehensive sample of the labor market which also carries the penalties of law for reporting incorrectly) and uses them to check the statistical assumptions the BLS makes in its Establishment Survey about payroll growth. These are never going to be perfect matches, so some adjustment is always necessary. What preliminary assessment found last year, though, was that between March 2018 and March 2019 one-fifth of the payrolls the BLS believed had been gained in the Establishment Survey during that twelve-month period hadn’t been. The state tax data showed substantially less employment growth, about half a million phantom payrolls. |
BLS Annual Bechmark Revisions, 1979-2019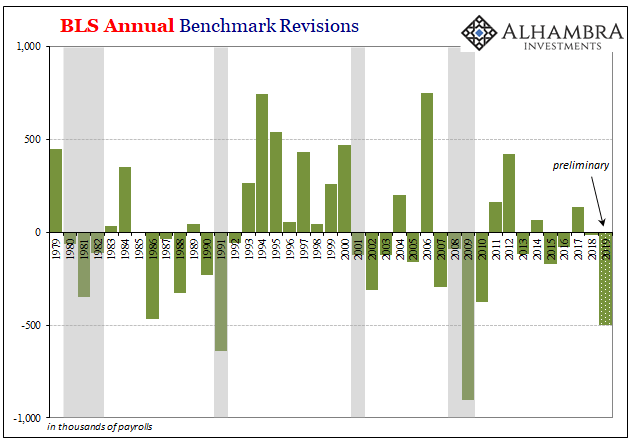 - Click to enlarge |
| It was 2009 the last time the Establishment Survey so overshot the labor market with its assumptions.
That doesn’t mean the US economy was in recession at some point between March 2018 and March 2019. It only suggests that the labor market, and therefore the economy, was probably significantly weaker than had been claimed at the time. This becomes cumulative, too, meaning if March 2018 to March 2019 was way less, March 2019 forward was as well. And that’s a huge problem because the data we have now keeps pointing in that same direction before we even get to next month’s write-downs. Since we only have the data we have, for this month we’re stuck with the current numbers. And that’s fine for our more immediate narrow purposes. What the estimates available to us show is a labor market heading in the wrong direction. What the benchmark changes should show is by how much. For the month of December 2019, the BLS today thinks payrolls grew by what almost everyone is saying was a disappointing 145k. That was down sharply from November’s revised 256k, which had been (and still is) the first above 200k since last January. |
Establishment Survey; Payrolls, 2014-2019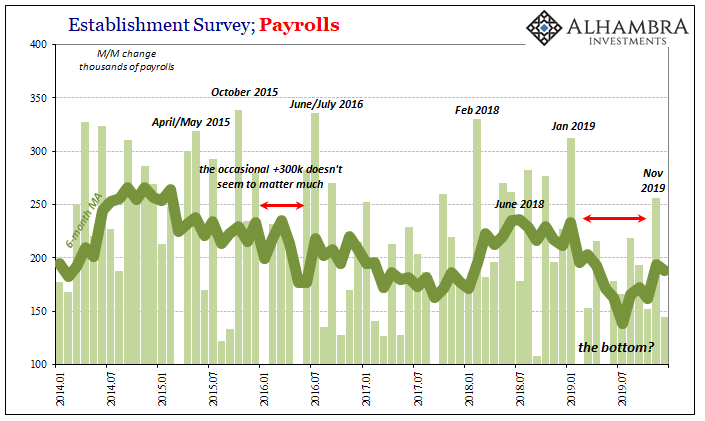 - Click to enlarge |
| You never, ever go by one month’s payroll changes but December’s looks too much like the rest of last year making November’s stick out like a sore thumb. Which one of these is the outlier?
With the December estimate available, we can do our annual calculations. These give us the benefit of skipping the monthly noisiness while putting the labor market in its proper context. A +200k payroll change today is not the same as +200k twenty or thirty years ago. Population growth and non-linearity demand relative comparisons like these in order to make honest assessments. |
Labor Market Growth Rates by Calendar Year, 1968-2019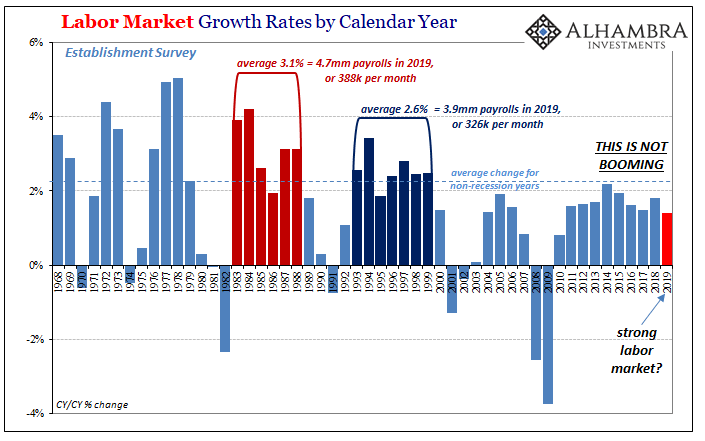 - Click to enlarge |
Labor Market Growth Rates by Calendar Year, 2003-2019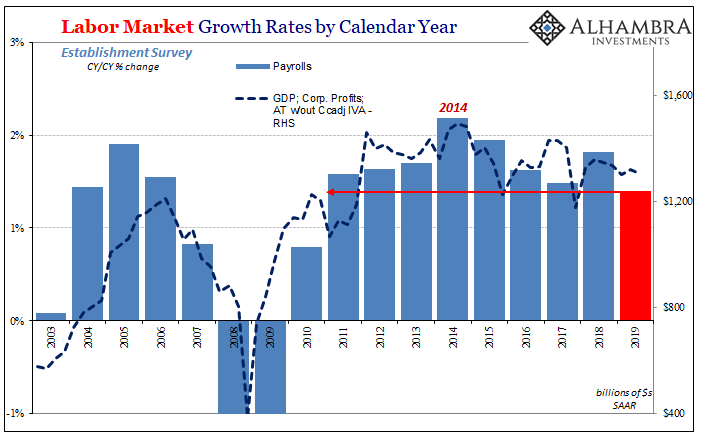 - Click to enlarge |
|
| What this shows is that the US jobs market in 2019 was the weakest it had been since 2010. It wasn’t a disaster, like 2007, but by the same token it wasn’t what Jay Powell kept saying, either. The labor market is strong, according to the mainstream view, and yet there’s only one datapoint aligning with that interpretation (the suspect, uncorroborated unemployment rate).
The rest of the figures are all saying the same thing as these annual comparisons – the weakest in a very long time. |
Average Weekly Hours All Employees, 2007-2019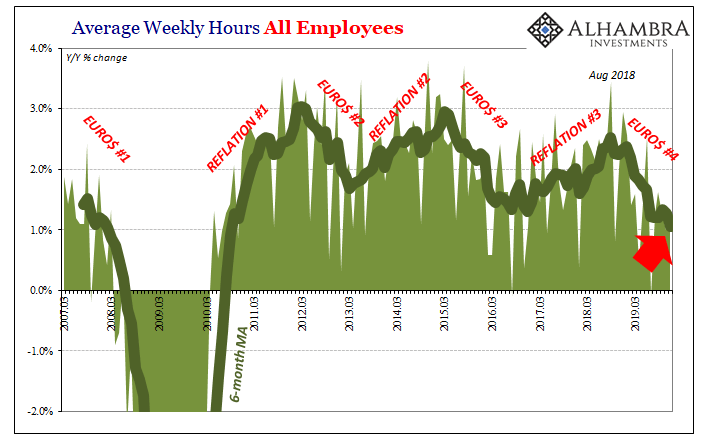 - Click to enlarge |
Average Weekly Hours All Employees, 2006-2019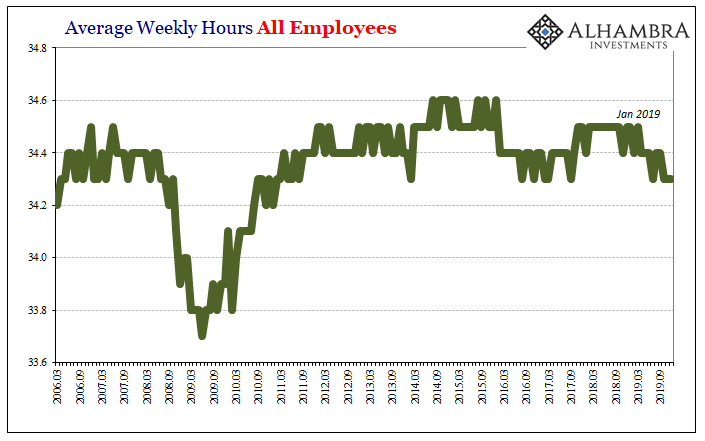 - Click to enlarge |
|
| The most concerning (by far) out of the underlying data has to be hours. As we pointed out throughout 2019, these estimates are wholly inconsistent with anything being strong anywhere. This cuts across manufacturing versus services, too, a broad cross section of labor utilization for any and all economic purposes.
Not only is growth in hours the weakest also since 2010, the monthly changes are still decelerating. This undercuts the other narrative about general conditions, particularly the way last year was supposed to have ended. It said our strong economy wasn’t quite as strong, it has softened a tiny bit, thus three rate cuts, but it finished 2019 on the way up rather than continuing to soften. As noted earlier this week, outside of sentiment figures easily swayed by “stimulus” assumptions, the data contradicts that assessment. |
Full Employment Slack, 1983-2019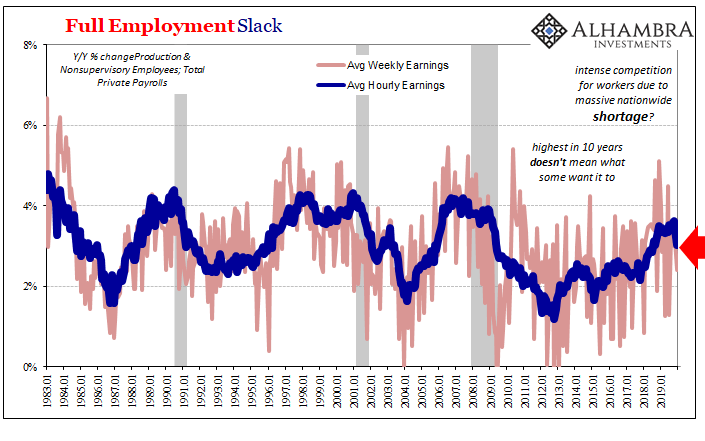 - Click to enlarge |
| At best, some of the series are neutral – as in, they haven’t gotten worse after falling off substantially. The rest, the majority are like what we see here in hours – still slowing down into 2020.
The hours numbers as a proxy for labor utilization very closely matches the JOLTS survey (as well as others) which are a proxy for labor demand (also decelerating). Today’s payroll report adds another one to those: wage rates. These had been the most important numbers for economists and central bankers during 2018, to confirm their R*, zero output gap no-slack theory. Not only did wages fail them then, growth just declined sharply. According to the BLS, the average hourly wage increased by 3.03% year-over-year in December. That was the lowest since September 2018, a very steep two-month decline (3.39% in November, both down from 3.62% in October) and like hours and JOLTS suggests serious strains and weakening in the labor market. That’s the largest two-month downshift in the average hourly wage since 2003. Demand and utilization tailing off – not crashing – in a manner totally inconsistent with Richard Clarida and his “The U.S. |
Labor Market Growth Rates by Calendar Year, 1995-2019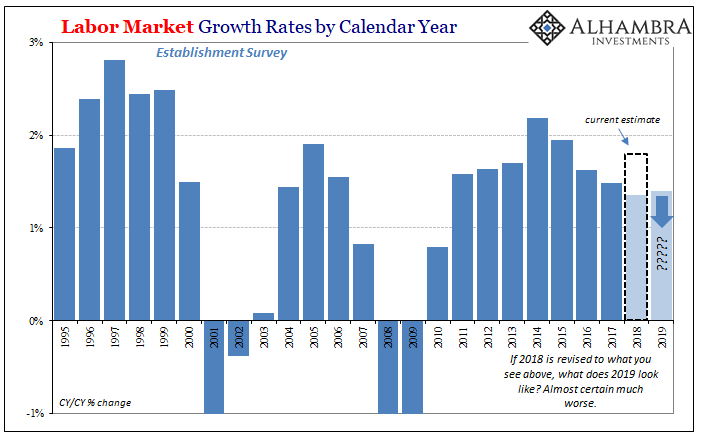 - Click to enlarge |
economy begins the year 2020 in a good place.”
It is not in recession, but that still can’t be ruled out. The risks of one keep rising as the economy more and more synchronizes with the global downturn.
And that’s just what the current estimates say. There will be changes to the headline payroll numbers next month, which will (should, anyway) change how we all view the last few years. As I pointed out before, even the FOMC knows what’s coming – in the limited sense of the BLS data; they have little to no idea about the economy.
However, the pace of job gains so far this year was slower than last year, even after accounting for the anticipated effects of the Bureau of Labor Statistics’ benchmark revision to payroll employment, which will be incorporated in the published data in February 2020. emphasis added
What might that look like?
No wonder Powell thought he’d be raising rates in 2019 and had no idea (the markets did) he’d be lowering them instead. It won’t be recalculated down to something like recession, but it will in all likelihood be revised to a position way too close to one and therefore heightened risks of one. Together with the hours data and the potentially sharp deceleration in wages…
The US economy begins the year 2020 in rough shape, very rough shape.
Tags: average hourly earnings,average weekly hours,benchmark revisions,bls,currencies,economy,establishment survey,Featured,Federal Reserve/Monetary Policy,hours,hours worked,household survey,jay powell,jobs,jolts,Labor Market,Markets,newsletter,payrolls,rate cuts,recession,wages