We do not like Purchasing Power or Real Effective Exchange Rate (REER) as measurement for currencies. For us, the trade balance decides if a currency is overvalued. Only the trade balance can express productivity gains, while the REER assumes constant productivity in comparison to trade partners. Who has read Michael Pettis, knows that a rising trade surplus may also be caused by a higher savings rate while the trade partners decided to spend more. This is partially true. Recently Europeans started to increase their savings rate, while Americans reduced it. This has led to a rising trade and current surplus for the Europeans. But also to a massive Swiss trade surplus with the United States, that lifted Switzerland on the U.S. currency manipulation watch list. To
Topics:
George Dorgan considers the following as important: 2.) Trade Balance News Service Bunt [FR], 2) Swiss and European Macro, Featured, newsletter, Switzerland Exports, Switzerland Exports by Sector, Switzerland Imports, Switzerland Imports by Sector, Switzerland Trade Balance
This could be interesting, too:
Nachrichten Ticker - www.finanzen.ch writes Die Performance der Kryptowährungen in KW 9: Das hat sich bei Bitcoin, Ether & Co. getan
Nachrichten Ticker - www.finanzen.ch writes Wer verbirgt sich hinter der Ethereum-Technologie?
Martin Hartmann writes Eine Analyse nach den Lehren von Milton Friedman
Marc Chandler writes March 2025 Monthly
We do not like Purchasing Power or Real Effective Exchange Rate (REER) as measurement for currencies. For us, the trade balance decides if a currency is overvalued. Only the trade balance can express productivity gains, while the REER assumes constant productivity in comparison to trade partners.
Who has read Michael Pettis, knows that a rising trade surplus may also be caused by a higher savings rate while the trade partners decided to spend more. This is partially true. Recently Europeans started to increase their savings rate, while Americans reduced it. This has led to a rising trade and current surplus for the Europeans. But also to a massive Swiss trade surplus with the United States, that lifted Switzerland on the U.S. currency manipulation watch list.
To control the trade balance against this “savings effect”, economists may look at imports. When imports are rising at the same pace as GDP or consumption, then there is no such “savings effect”.
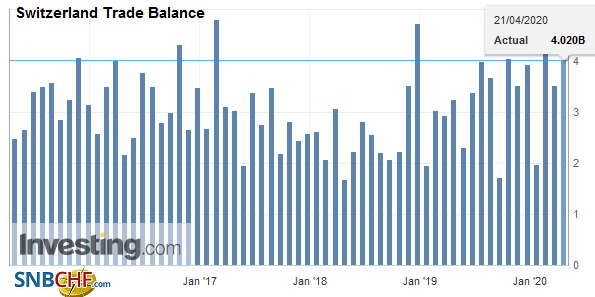
After the record trade surpluses, the Swiss economy may have turned around: consumption and imports are finally rising more than in 2015 and early 2016. In March the trade surplus got bigger again, still shy of the records in 2016.
Swiss National Bank wants to keep non-profitable sectors alive
Swiss exports are moving more and more toward higher value sectors: away from watches, jewelry and manufacturing towards chemicals and pharmaceuticals. With currency interventions, the SNB is trying to keep sectors alive, that would not survive without interventions.
At the same time, importers keep the currency gains of imported goods and return little to the consumer. This tendency is accentuated by the SNB, that makes the franc weaker.
Texts and Charts from the Swiss customs data release (translated from French).
Exports and Imports YoY DevelopmentThe boom in chemicals and pharmaceuticals enabled Swiss exports to increase in March as well as in the first quarter of 2020 (+ 2.2% respectively + 1.0%). Despite the global economic situation linked to the “Covid-19”, the performance of this sector offset the decline suffered by most of the other groups. As in the previous quarter, seasonally adjusted imports fell (- 2.8%). The trade balance for the first three months of 2020 ends with a surplus of 8.3 billion francs. In short ▲ Chemicals-pharma: record quarterly entry and exit levels ▲ The upward trend in exports to the USA continues ▼ Lower sales for most sectors ▼ Exports to China and Hong Kong plunge by 445 million francs ▼ Exports in March 2020: -16% for machinery and electronics and -11% for watchmaking |
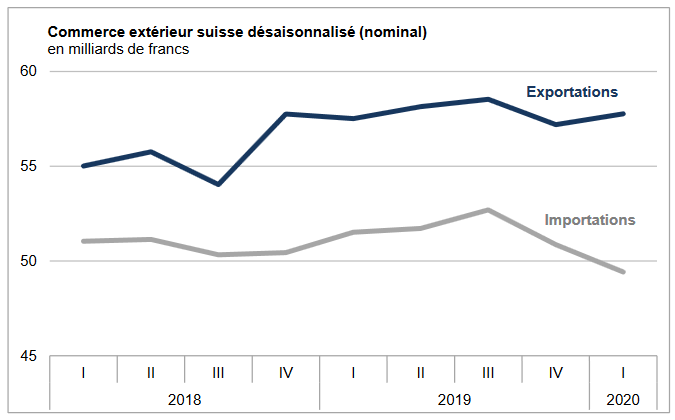
Swiss exports and imports, seasonally adjusted (in bn CHF), Q1 2020(see more posts on Switzerland Exports, Switzerland Imports, ) |
Global evolutionDuring the first quarter of 2020, seasonally adjusted exports increased by 1.0% to 57.8 billion francs (actual: -0.6%). They thus stand at their level of the last quarter of 2018, confirming their flat trend registered since. Imports contracted by 2.8% to 49.4 billion francs (real: -3.2%), their lowest level since the first quarter of 2018. The trade balance closed with a surplus of 8.3 billion francs. |
Switzerland Trade Balance, March 2020(see more posts on Switzerland Trade Balance, ) Source: investing.com - Click to enlarge |
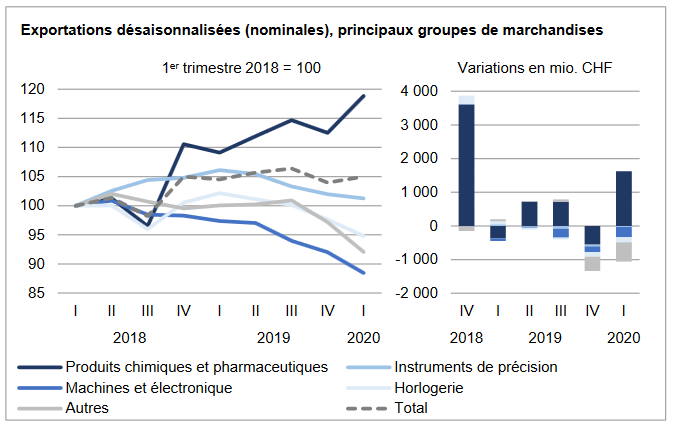
ExportsBroadly sustained growth in chemicals-pharma exports The increase in exports rested exclusively on chemical and pharmaceutical products (+ 5.6% or +1.6 billion francs), whose growth compensated for the woes of other sectors. Within the flagship sector, all sub-groups contributed to the growth. With a jump of 10%, the active ingredients (+361 million francs), however, stood out. By briskly crossing the 30 billion franc mark, the sector’s exports reached a new historic high. Conversely, the vehicle (-15.7%), metals (- 5.2%), machinery and electronics (- 3.9%) and watchmaking (-2.9%) sectors suffered; their cumulative decline reached 841 million francs. If precision instruments saved the furniture (-0.7%), their trend – like that of the aforementioned groups – remains downward oriented. A disparate development has characterized the three main markets. Exports increased by 7.8% to North America (USA: +974 million francs) while those to Europe increased by 0.7%. Sales to Asia fell 1.1%. Here, Hond Kong (-13.5%) and China (-8.0%) were the most affected, contrasting with the rise in Japan and Singapore. On the Old Continent, Ireland (+ 49.7%) and Austria (+ 30.2%) shone while Belgium fell by a quarter; for most of these countries, chemicals and pharmaceuticals have played a major role. Sales to Russia, for their part, fell by 15.5%. |
Swiss Exports per Sector Q1 2020 vs. 2019(see more posts on Switzerland Exports, Switzerland Exports by Sector, ) |
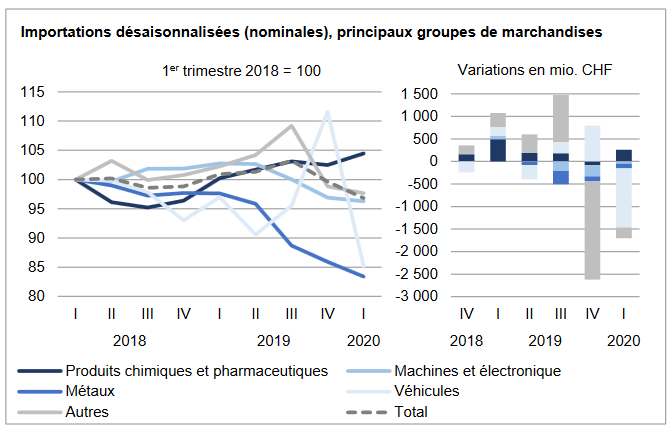
ImportsImports of the United Kingdom and Ireland fall sharply The decrease at entry is mainly explained by the contraction in vehicles (aeronautics: -893 million francs). Receipts from metals (-104 million) and from the machinery and electronics sector (-49 million) also declined; for these two sectors, the negative trend that started in the first quarter and second quarter of 2019, thus continued. The textiles, clothing and footwear sector fell by 179 million francs and the energy products by 97 million. Conversely, chemical and pharmaceutical products (+257 million) reached a new quarterly peak at 13.6 billion francs. Jewelery also rose slightly (+62 million). Compared to the last quarter of 2019, imports from the three main markets lost ground. North America (-11.1%; USA: -547 million francs) suffered the largest decline; this therefore puts an end to the positive trend recorded since the second quarter of 2019. Europe, for its part, suffered its fourth consecutive quarterly setback (-0.7%); it gained a foothold in the United Kingdom, Ireland and Germany, whose cumulative decline reached 1.1 billion francs. Conversely, arrivals from France (+550 million) and Austria (+242 million) increased. Asia (-0.7%) also declined slightly, mainly from the United Arab Emirates (-246 million; gold jewelry for the redesign) and China (-107 million). Conversely, imports from Hong Kong have doubled after declining in the past two quarters. |
Swiss Imports per Sector Q1 2020 vs. 2019(see more posts on Switzerland Imports, Switzerland Imports by Sector, ) |
Tags: Featured,newsletter,Switzerland Exports,Switzerland Exports by Sector,Switzerland Imports,Switzerland Imports by Sector,Switzerland Trade Balance


