In Other Global Markets the “Turn-of-the-Month” Effect Generates Even Bigger Returns than in the US The “turn-of-the-month” effect is one of the most fascinating stock market phenomena. It describes the fact that price gains primarily tend to occur around the turn of the month. By contrast, the rest of the time around the middle of the month is typically far less profitable for investors. The effect has been studied extensively in the US market. In the last issue of Seasonal Insights I have shown a table detailing the extent of the “turn-of-the-month” effect in the eleven largest international stock markets. The result was that overseas markets also tend to be significantly stronger around the turn of the month than
Topics:
Dimitri Speck considers the following as important: 6) Gold and Austrian Economics, 6b) Austrian Economics, 7) Markets, Chart Update, Featured, newsletter, The Stock Market
This could be interesting, too:
Nachrichten Ticker - www.finanzen.ch writes Die Performance der Kryptowährungen in KW 9: Das hat sich bei Bitcoin, Ether & Co. getan
Nachrichten Ticker - www.finanzen.ch writes Wer verbirgt sich hinter der Ethereum-Technologie?
Martin Hartmann writes Eine Analyse nach den Lehren von Milton Friedman
Marc Chandler writes March 2025 Monthly
In Other Global Markets the “Turn-of-the-Month” Effect Generates Even Bigger Returns than in the USThe “turn-of-the-month” effect is one of the most fascinating stock market phenomena. It describes the fact that price gains primarily tend to occur around the turn of the month. By contrast, the rest of the time around the middle of the month is typically far less profitable for investors. The effect has been studied extensively in the US market. In the last issue of Seasonal Insights I have shown a table detailing the extent of the “turn-of-the-month” effect in the eleven largest international stock markets. The result was that overseas markets also tend to be significantly stronger around the turn of the month than around the middle of the month – in fact, in all countries under review the effect was even more pronounced than in the US. |
|
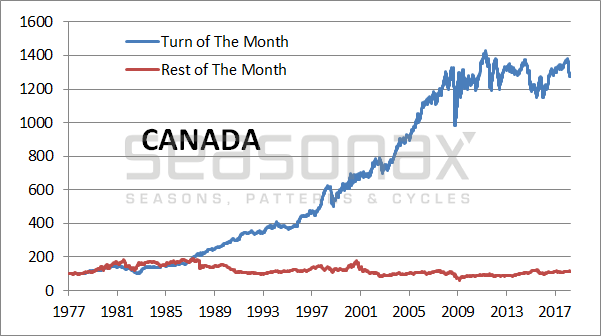
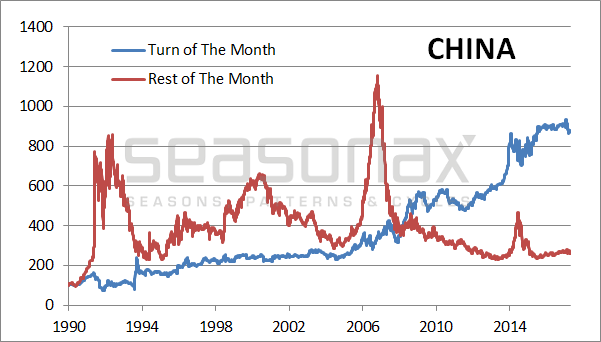
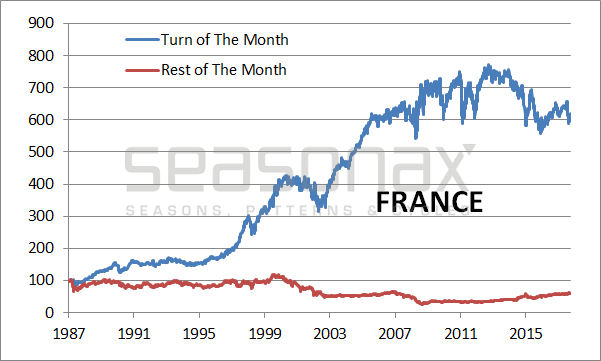
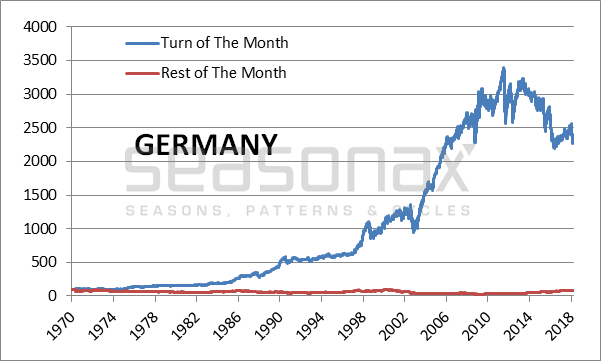
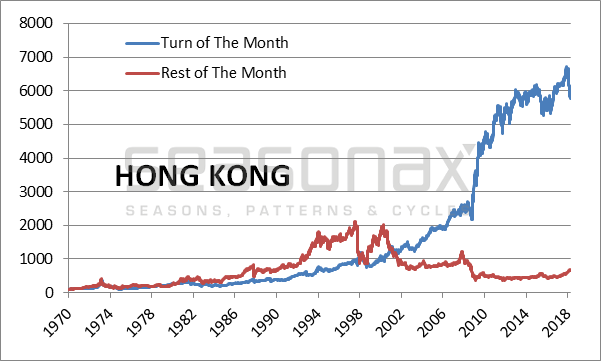
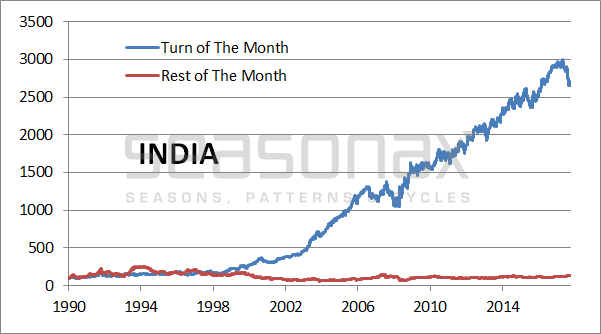
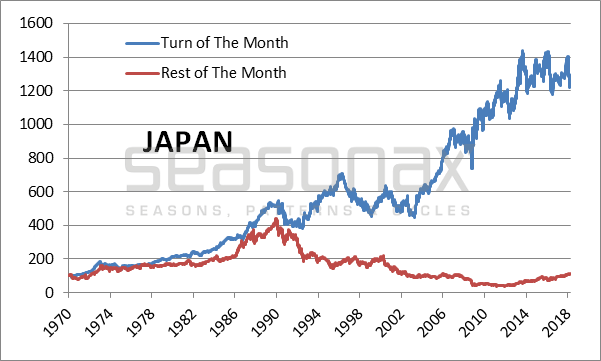
The Turn-of-the-Month Pattern in 11 CountriesThe following charts show the cumulative returns achieved over time in all eleven countries around the turn of the month (blue lines) and around the middle of the month (red lines). I have measured the average return of investing in these indexes in the time period from the 26th of each month to the 5th of the subsequent month, i.e., over a period of slightly less than two weeks around the turn of the month. Then I compared this return with that achieved by investing during the rest of the time around the middle of the month, i.e., from the 6th to the 25th of each month. Canada: Cumulative return around the turn of the month (blue line) and over the rest of the time (red line), indexed (100) |
Canada Cumulative Returns Achieved, 1977 - 2018 |
| China: Cumulative return around the turn of the month (blue line) and over the rest of the time (red line), indexed (100) |
China Cumulative Returns Achieved, 1990 - 2018 |
| France: Cumulative return around the turn of the month (blue line) and over the rest of the time (red line), indexed (100) |
France Cumulative Return Achieved, 1987 - 2018 |
| Germany: Cumulative return around the turn of the month (blue line) and over the rest of the time (red line), indexed (100) |
Germany Cumulative Return Achieved, 1970 - 2018 |
| Hong Kong: Cumulative return around the turn of the month (blue line) and over the rest of the time (red line), indexed (100) |
Hong Kong Cumulative Return Achieved, 1970 - 2018 |
| India: Cumulative return around the turn of the month (blue line) and over the rest of the time (red line), indexed (100) |
India Cumulative Return Achieved, 1990 - 2018 |
| Japan: Cumulative return around the turn of the month (blue line) and over the rest of the time (red line), indexed (100) |
Japan Cumulative Return Achieved, 1970 - 2018 |
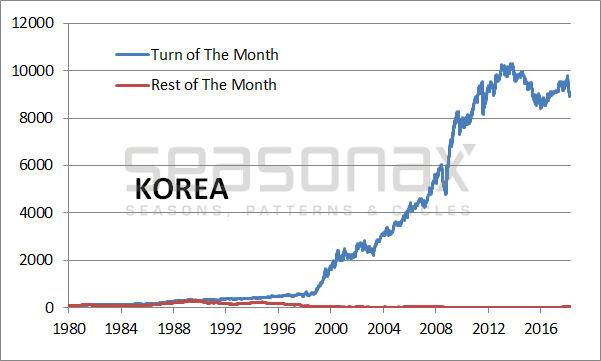
| Korea: Cumulative return around the turn of the month (blue line) and over the rest of the time (red line), indexed (100) |
Korea Cumulative Return, 1980 - 2018 |
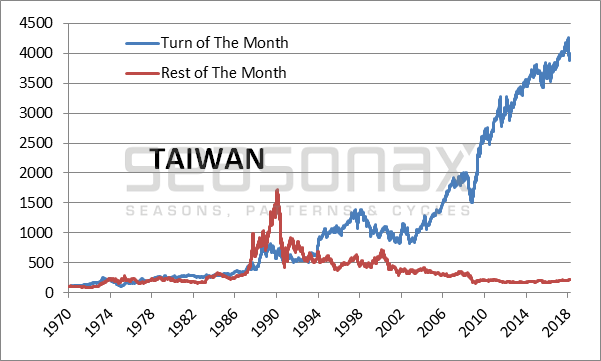
| Taiwan: Cumulative return around the turn of the month (blue line) and over the rest of the time (red line), indexed (100) |
Taiwan Cumulative Return Achieved, 1970 - 2018 |
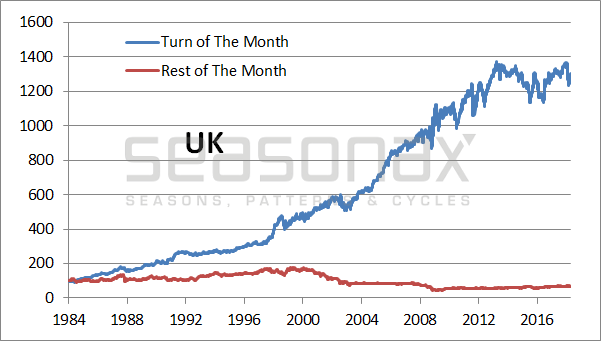
| Great Britain: Cumulative return around the turn of the month (blue line) and over the rest of the time (red line), indexed (100) |
United Kingdom Cumulative Return Achieved, 1984 - 2018 |
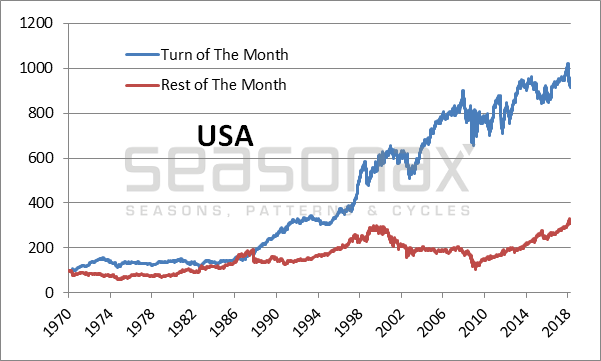
| US: Cumulative return around the turn of the month (blue line) and over the rest of the time (red line), indexed (100) |
USA Cumulative Return Achieved, 1970 - 2018 |
| Evidently stock market investments all over the world generate significantly larger gains around the turn-of-the-month than around the middle of the month. Clearly the turn-of-the-month-effect is a phenomenon of global relevance.
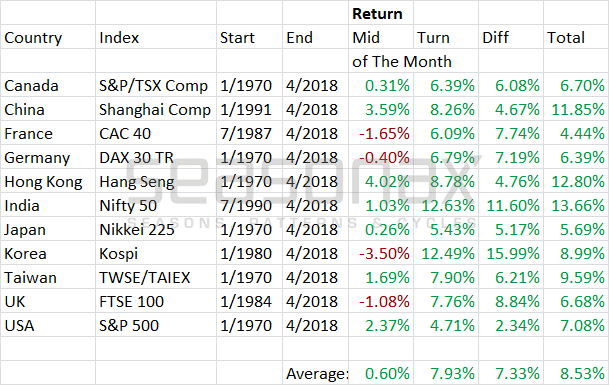
Another Look at the Details Below I once again show you a table detailing the returns of the turn-of-the-month period compared to those achieved in the mid-month period in the eleven countries under review. Turn-of-the-month effect in selected countries |
The column designated “Diff” shows the excess return of the turn-of-the-month period over the mid-month period. As a glance at this column immediately makes clear, the gains achieved by investing in the turn-of-the-month period are beating those of the mid-month period in all eleven countries, in most cases by quite a significant margin. These excess returns are achieved despite the fact that the time period during which the turn-of-the-month effect occurs is actually slightly shorter (this has implications for risk-adjusted returns).
This is a very simple seasonal pattern. There exist a great many more seasonal patterns, which can be identified with the Seasonax app on Bloomberg and/or Thomson-Reuters. Many of these patterns are still completely unknown – and potentially offer even more substantial outperformance.
Charts by: Seasonax
Chart and image captions by PT, edited by PT
Tags: Chart Update,Featured,newsletter,The Stock Market

