The risk budget changes this month as I add back the 5% cash raised in late October. For the moderate risk investor, the allocation to bonds is still 50% while the risk side now rises to 50% as well. I raised the cash back in late October due to the extreme overbought nature of the stock market and frankly it was a mistake. Stocks went from overbought to more overbought and I missed the rally to all time highs in January. Both the assets I sold in that update (SPY and GNR) are higher now, even after the early February pullback. The overbought condition that I used as justification for selling SPY has largely been corrected – at least on a short time scale. The dollar rally I feared would negatively impact GNR came
Topics:
Joseph Y. Calhoun considers the following as important: 5) Global Macro, Alhambra Research, asset allocation, bonds, commodities, credit spreads, currencies, emerging markets, Featured, Global Asset Allocation Update, Gold, inflation, Investing, Japan, Market Sentiment, Markets, Model Portfolios, momentum, newsletter, Real estate, stocks, TIPS, US dollar, valuations, wework, Yield Curve
This could be interesting, too:
Nachrichten Ticker - www.finanzen.ch writes Die Performance der Kryptowährungen in KW 9: Das hat sich bei Bitcoin, Ether & Co. getan
Nachrichten Ticker - www.finanzen.ch writes Wer verbirgt sich hinter der Ethereum-Technologie?
Martin Hartmann writes Eine Analyse nach den Lehren von Milton Friedman
Marc Chandler writes March 2025 Monthly
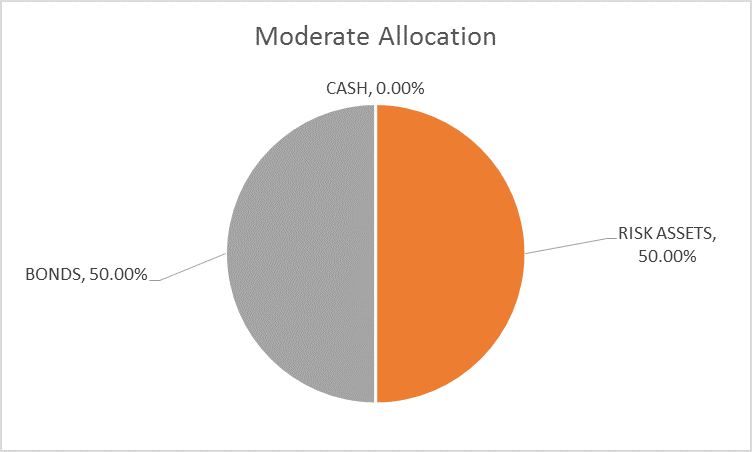
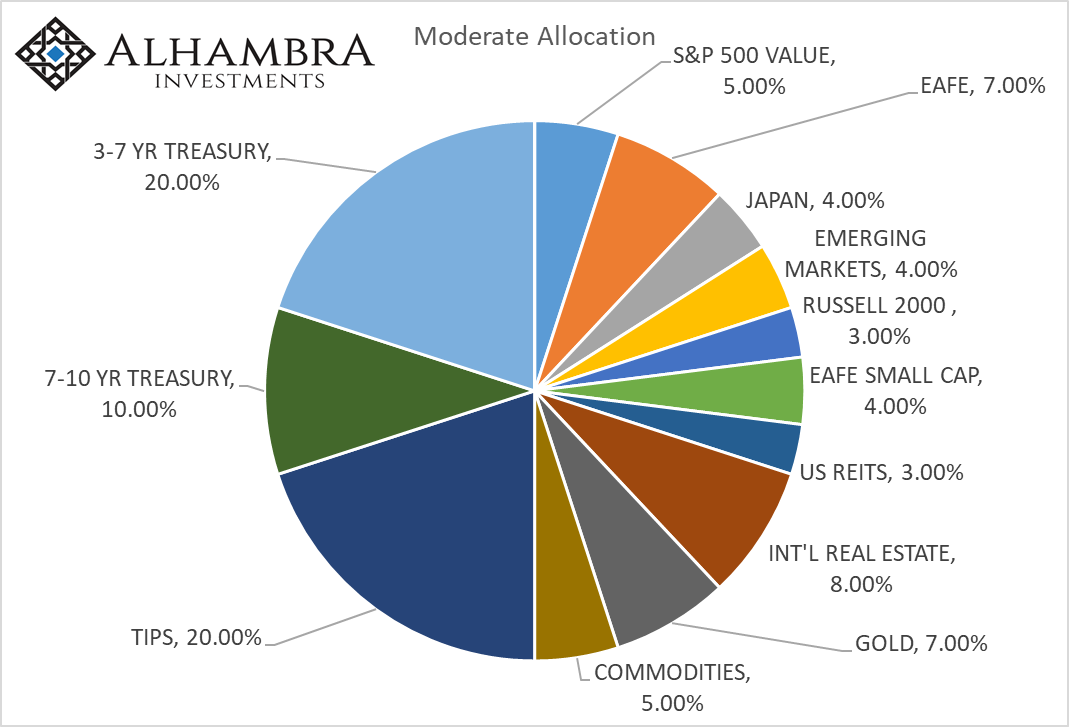
The risk budget changes this month as I add back the 5% cash raised in late October. For the moderate risk investor, the allocation to bonds is still 50% while the risk side now rises to 50% as well. I raised the cash back in late October due to the extreme overbought nature of the stock market and frankly it was a mistake. Stocks went from overbought to more overbought and I missed the rally to all time highs in January. Both the assets I sold in that update (SPY and GNR) are higher now, even after the early February pullback. The overbought condition that I used as justification for selling SPY has largely been corrected – at least on a short time scale. The dollar rally I feared would negatively impact GNR came but didn’t impact commodities in a significant way.
I’ve spent a lot of time thinking about how to correct this mistake. It would have been easy to just continue sitting on the sidelines in cash. At least we get paid something on cash now; the Fed’s rate hikes have worked in that regard. If you go back and read that update (see here), I cited sentiment and momentum – very similar terms in that momentum reflects sentiment – as a justification for raising cash. I won’t apologize for recognizing those conditions and acting on them – it was a conservative move and we serve a pretty conservative investor base – but I do want to learn from the experience. The lesson is that sentiment alone is not sufficient to warrant a change in strategic allocation. The crowd is right sometimes and often for a lot longer than we are comfortable with. You need something else to justify a change in allocation. In our process that would mean a widening of credit spreads or some action in the yield curve that causes concern. We didn’t get either of those in October.
| It may be that I am compounding the mistake by eliminating the cash position now but I can’t justify holding it any longer within the guidelines established by our investment process.
The extreme sentiment that prevailed when I raised cash in October persisted right up to the correction in early February. If anything, sentiment got more extreme before it got crushed with the stock market selloff. January, in many ways, felt a lot like the blow-off move we often see at the end of a bull market. From the turn of the new year to January 26th, the S&P 500 only closed down 4 days (and those only marginally) while posting a nearly 7% gain. Like so many other things about this market, it reminded me of how the market acted in 1999. No, I’m not saying this market is as overvalued as that one – although in some ways it is and more – but it did have a similar feel to it. Only time will tell whether that was the top of this bull market. Sentiment has since moderated quite a bit although I still wouldn’t classify the mood as dour. WeWork, the company I profiled in that October update, is still a speculative, unprofitable mess with an iffy business model and a management team that is barely old enough to shave. People are starting to question their business model, their financials and even their ethics to some degree. That didn’t prevent them from floating a $500 million bond issue that was quickly raised to $700 million which doesn’t happen unless there is demand for the issue. The ethical issue is that one of the company’s many sidelines – WeLive, Wavegarden and apparently WeEducate are other examples – is advising a fund that will buy real estate which it intends to lease to WeWork. That seems a pretty clear conflict of interest to me but maybe their bondholders see things differently. Some buyer’s remorse already seems to be setting in with the newly issued bonds trading down to the mid-90s from par. But the mere fact that such a profit challenged company can raise that much money – albeit at nearly 8% for five years – is evidence enough that speculation lives in these markets. So, I’m not talking about a huge change in sentiment but things have clearly come off the boil a bit. The VIX, which spiked to over 50 in the early February panic, is back under 15…no wait….14…no….13. Not only that but the new popular trade is…wait for it….long volatility. Yes, for a number of weeks speculators were setting records with their net longs in the VIX complex. It’s backed off some now but spec longs still outnumber shorts in the latest COT report. The various survey based measures of sentiment have also moderated. The AAII investor poll showed nearly 60% bulls and a mere 15.5% bears in its January 4th survey. That has now shifted to a more balanced 33.5% bulls and 25.5% bears with the rest neutral. I’d like to see the numbers completely flipped with 60% bears but that probably won’t happen until we get a recession and full blown bear market. The Investor’s Intelligence poll is also fairly neutral with bulls down to 43.1 from nearly 70 at the peak. Bears are still a tad low but the bull/bear ratio is down to a fairly normal 2 from over 5 to1 at the peak. Putting this 5% cash position back in the market leaves us with an allocation that is still more conservative than our original strategic allocation. Our strategic allocation for a moderate portfolio calls for 40% bonds but we raised our bond allocation long ago due to valuation concerns. Our concerns on that front have not been alleviated and likely won’t be outside of a bear market. |
|
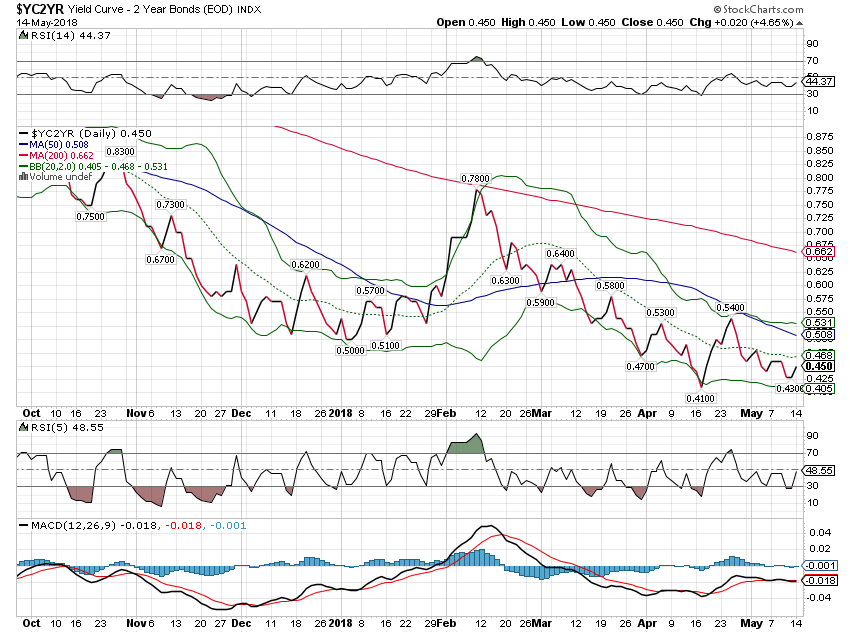
Yield Curve/RatesThe indicators we use to tactically change the allocation are not acting as we would expect prior to recession. The yield curve is flattening but it isn’t flat or inverted. |
Yield Curve - 2 Year Bonds, Oct 2017 - May 2018 |
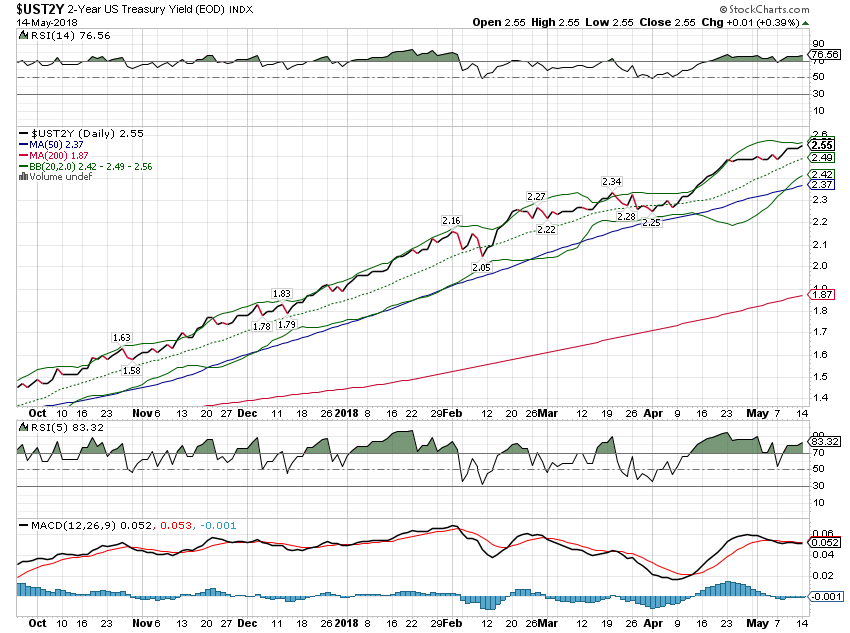
| Short term rates are still rising; the market’s expectations regarding monetary policy haven’t changed. |
US Treasury Yield Index, Oct 2017 - May 2018 |
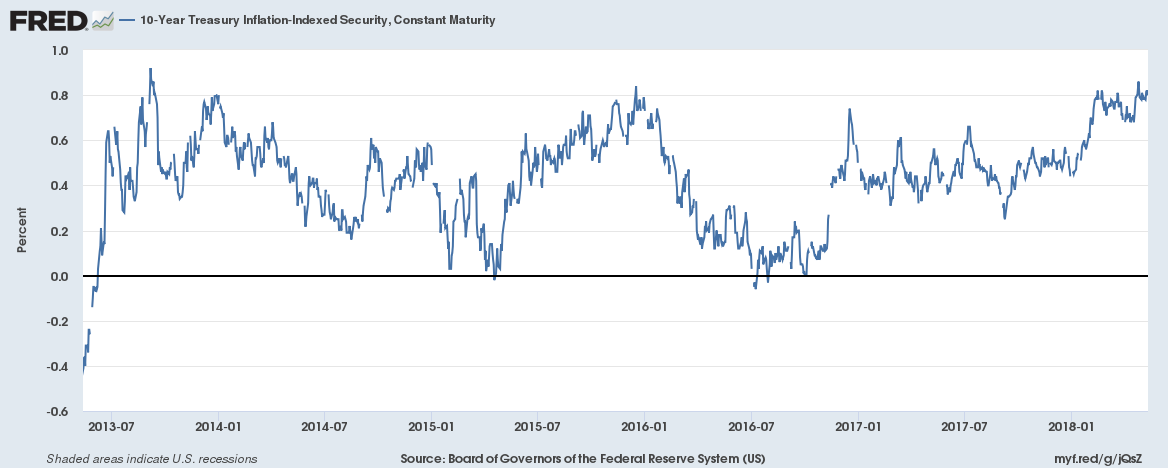
| 10 year TIPS yields are up 13 basis points since the last update and back at the top end of the range we’ve been in since 2013. Real growth expectations are stable. |
10 Year Treasury Inflation - Indexed Security, Constant Maturity, Jul 2013 - May 2018 |
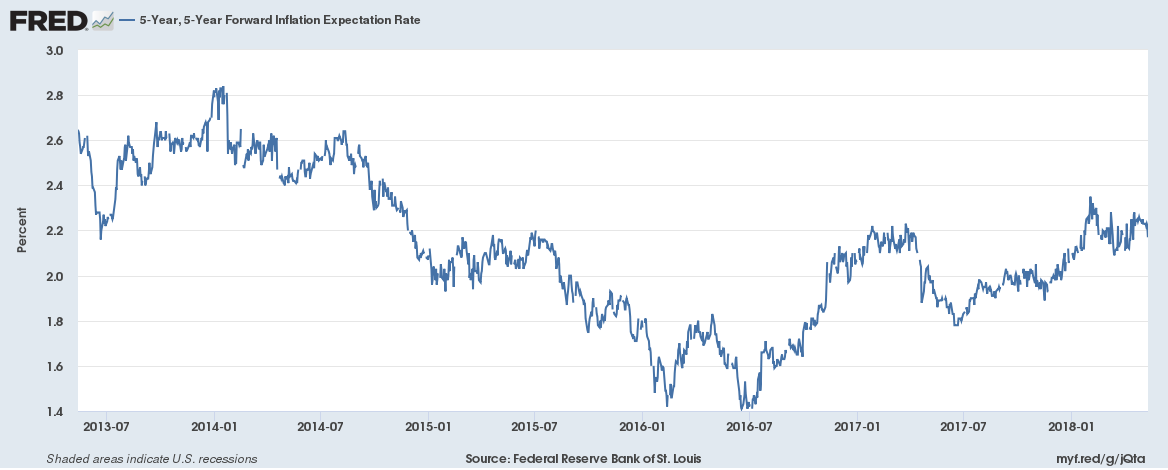
| Inflation expectations were basically unchanged since the last update. |
5 Year Forward Inflation Expectation Rate, Jul 2013 - May 2018 |
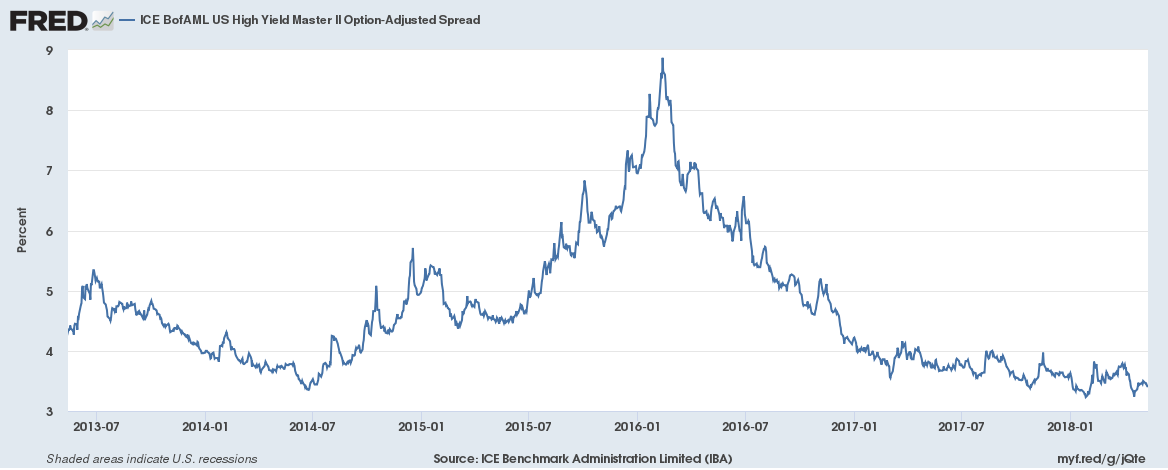
Credit SpreadsMeanwhile, credit spreads remain near the lows of the cycle and very well behaved. |
ICE BofAML US High Yield Master II Option-Adjusted Spread, Jul 2013 - May 2018 |
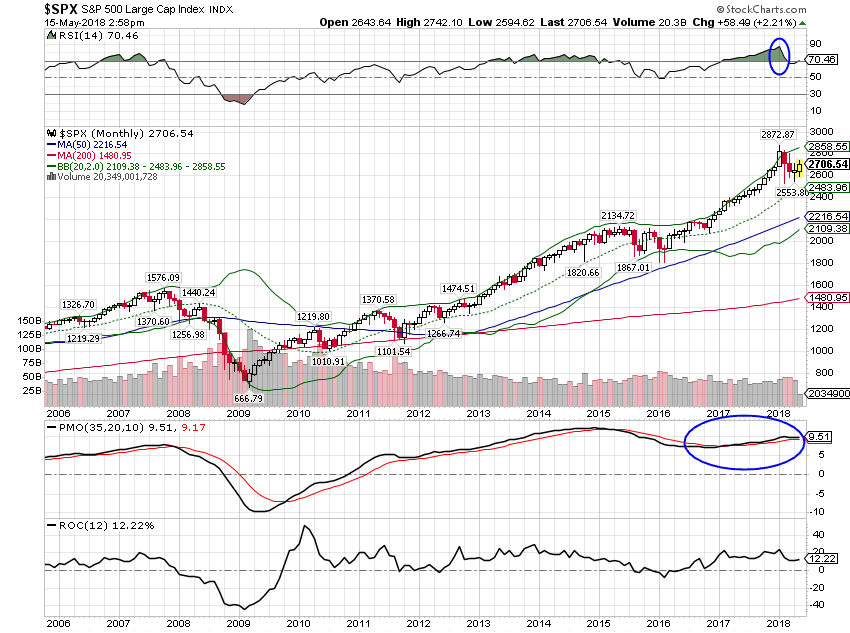
ValuationsA gangbuster earnings season means that some valuation measures based on earnings have improved modestly. With expectations for continued robust earnings growth, forward multiples are downright reasonable. Of course, that means almost nothing since earnings estimates are never so wrong as at turning points. Trailing P/Es have obviously improved too but have little predictive capacity. Meanwhile, other measures such as Price/Sales ratios and market cap/GDP are still at or near all time highs. US stocks are still very expensive. Foreign markets are still the place to find cheap stocks but the recently rising dollar has been a headwind. MomentumLong term momentum remains positive for the S&P 500. The overbought condition, as noted above, has been relieved but we never got to what I would call oversold. |
S&P 500 Large Cap Index, 2006 - 2018(see more posts on S&P 500 Large Cap Index, ) |
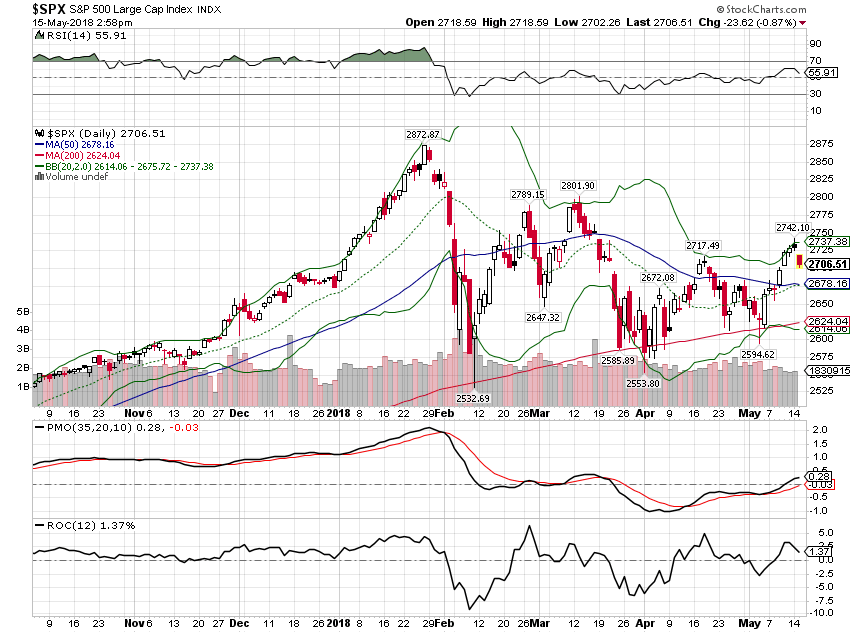
| Taking a shorter term view, the market tested the lows again and – to my surprise – held, at least so far. |
S&P 500 Large Cap Index, Nov 2017 - May 2018(see more posts on S&P 500 Large Cap Index, ) |
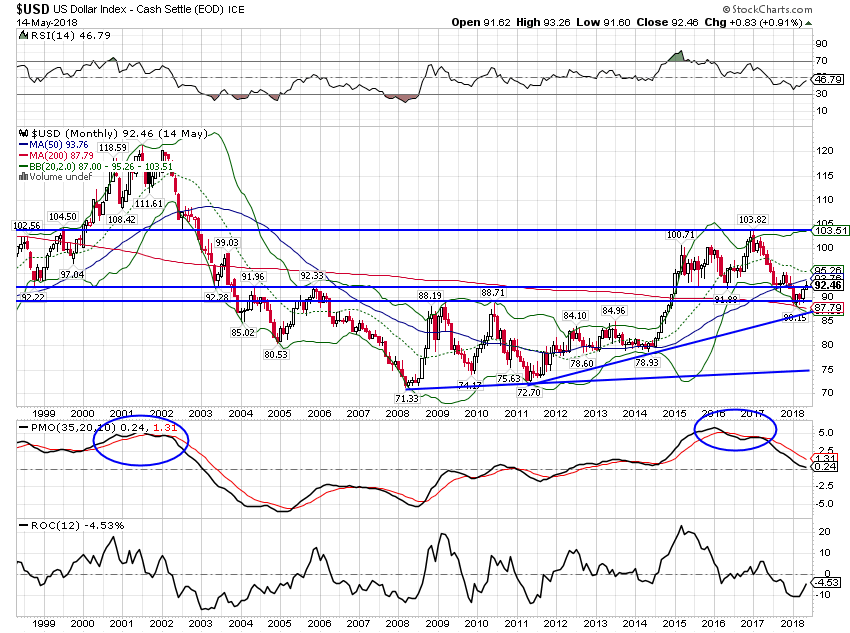
| The dollar has rallied off the lows but long term momentum continues to point south. If US rates continue rising that could change but as I’ve said many times, the administration has made it clear they want a weak dollar and they’ll probably get it. |
US Dollar Index, 1999 - 2018(see more posts on U.S. Dollar Index, ) |
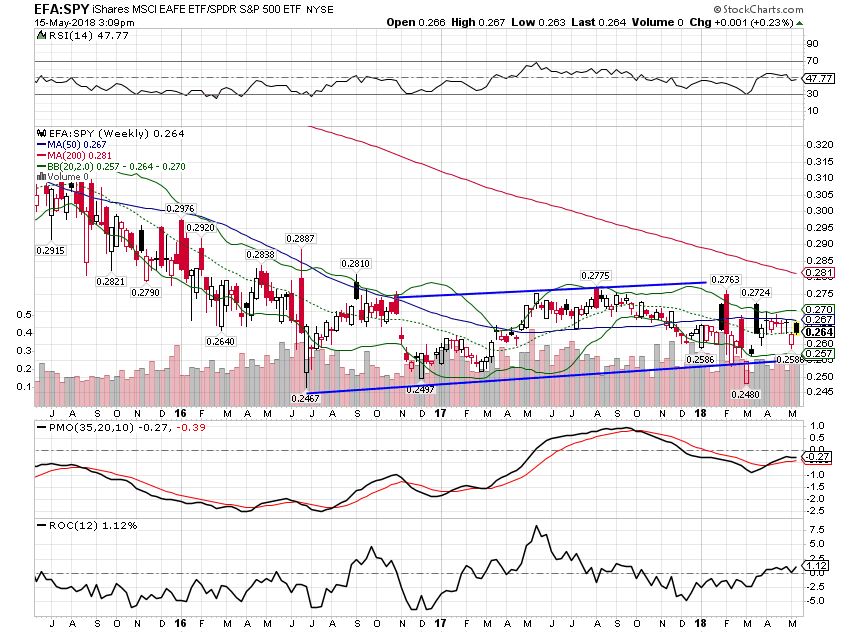
| Despite the dollar strength, the emerging uptrend of foreign stocks versus domestic remains intact. |
EFA:SPY Weekly, Jul 2015 - May 2018 |
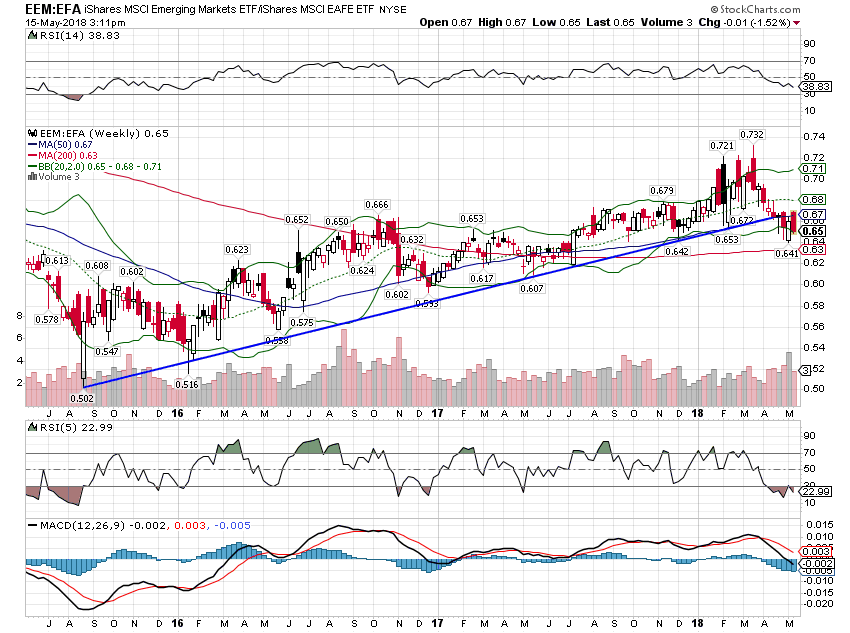
| The greater impact has been on EM shares where the intermediate uptrend of EEM vs EFA is in trouble. EM stocks are very volatile though and if the dollar resumes its downtrend, this trend should reassert itself. |
EEM:EFA Weekly, Jul 2015 - May 2018 |
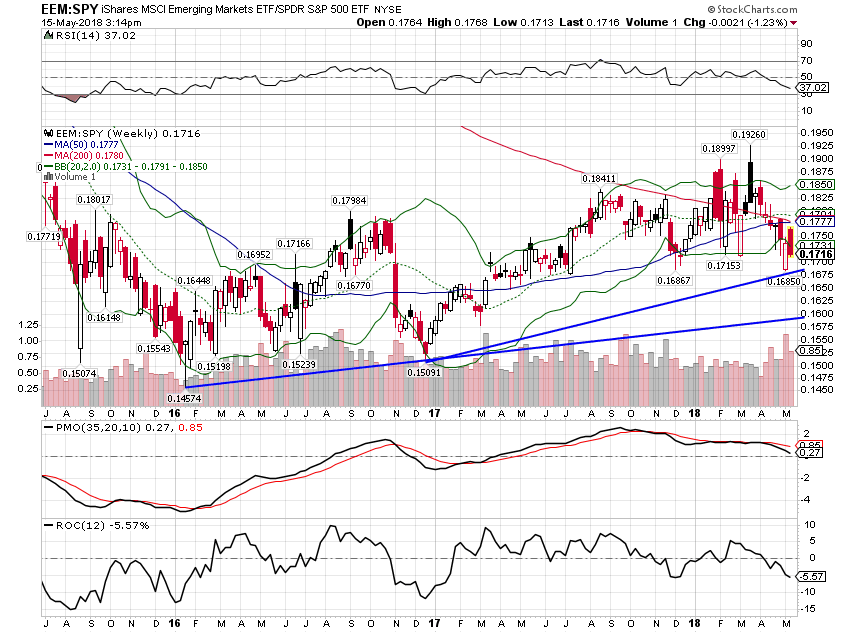
| The EM uptrend against SPY is being stretched to its limit as well. |
EEM:SPY Weekly, Jul 2015 - May 2018 |
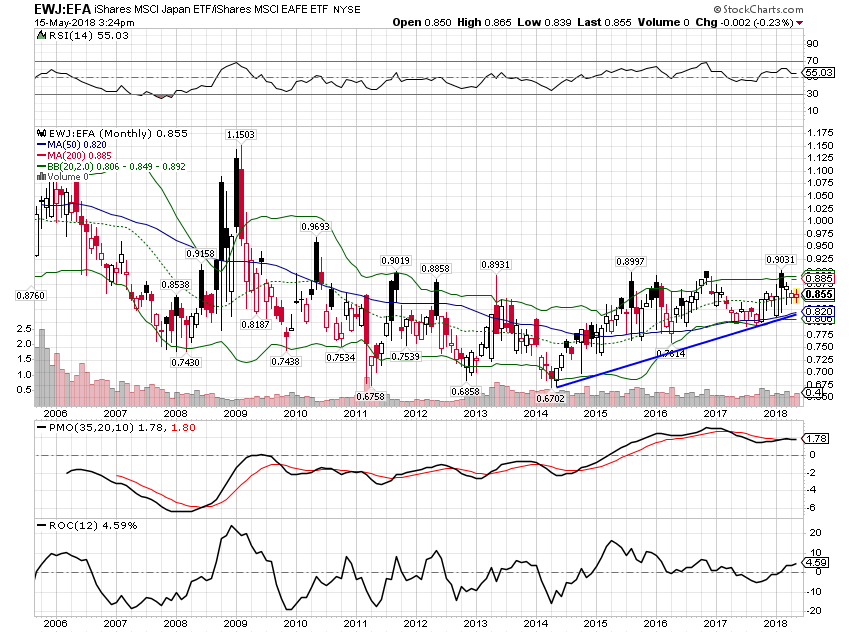
| Going back to the beginning of 2016, Japan is basically a push versus the EAFE but the longer term trend is intact. |
EWJ:EFA Monthly, 2006 - 2018 |
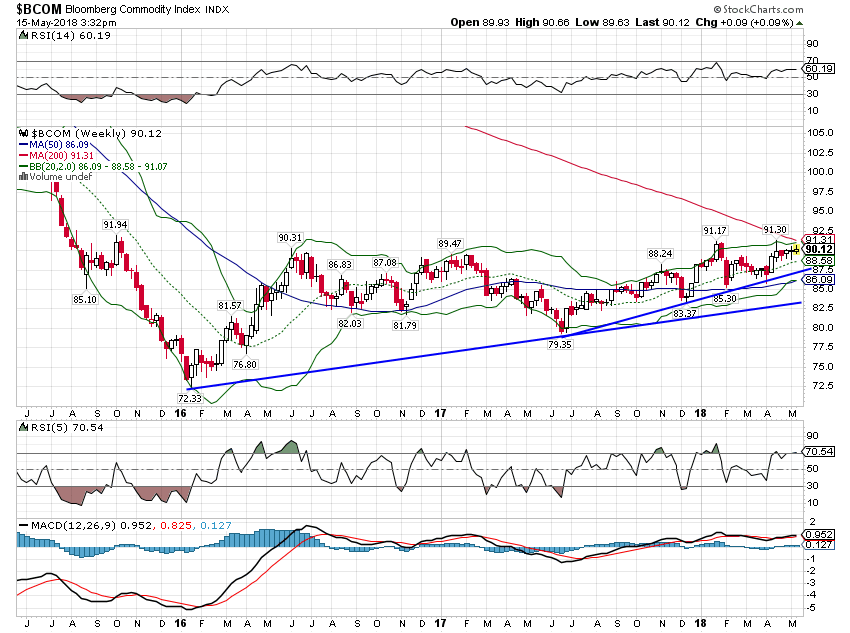
| The commodity uptrend continues despite recent dollar strength. |
Bloomberg Commodity Index, Jun 2015 - May 2018 |
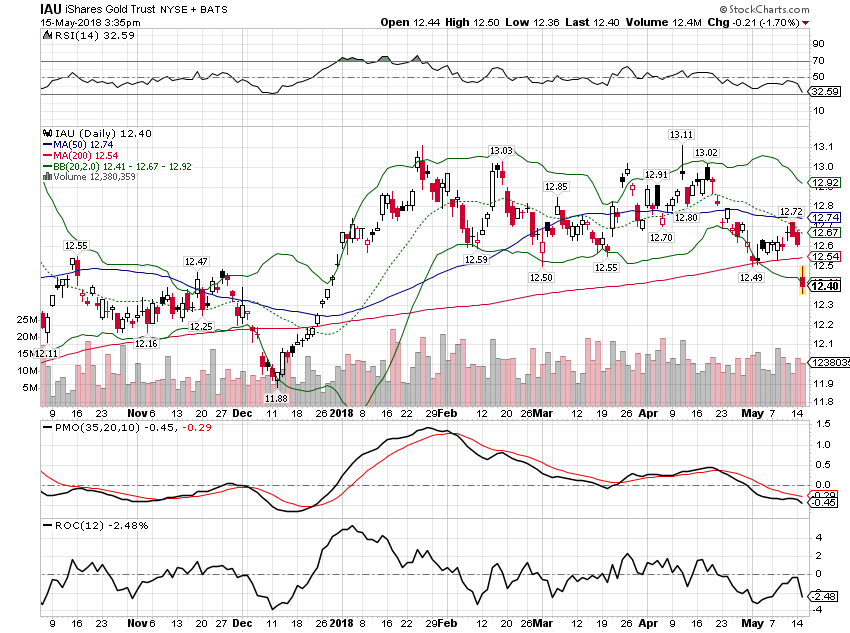
| Gold has corrected more than general commodities which indicates a renewed rise in real growth expectations. Not a big change yet but rates are getting very close to breaking out of that long term range. |
Gold Trust NYSE + BATS, Nov 2017 - May 2018 |
| The long term trend for gold is still up though: |
Gold Monthly, Oct 2005 - Apr 2018 |
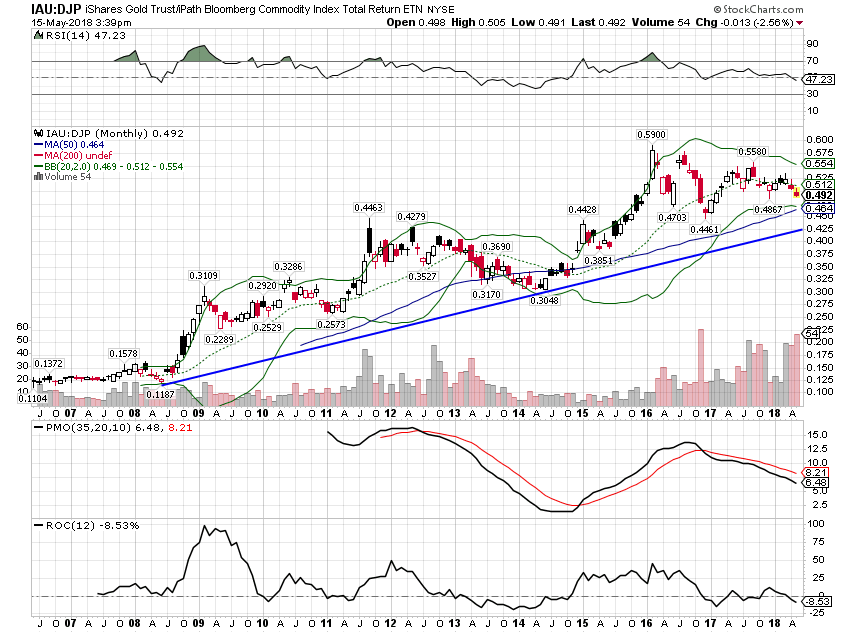
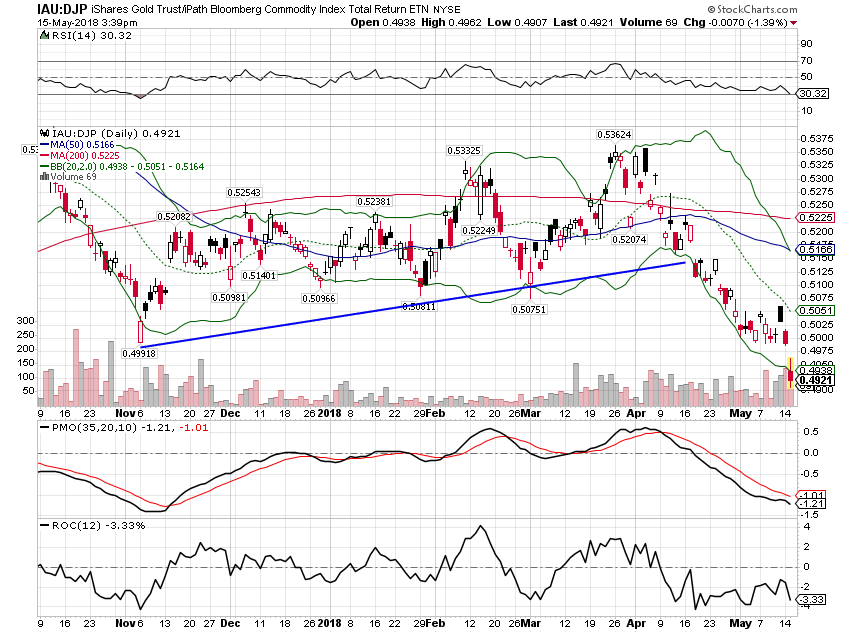
| The long term uptrend of gold versus the general commodity index has lost a lot of momentum over the last month. The trend is still up but momentum has diverged and not recovered. |
Gold Trust / Bloomberg Commodity Index Total Return, Jul 2006 - Apr 2018 |
| The short term trend has obviously broken down. |
Gold Trust / Bloomberg Commodity Index Total Return, Nov 2017 - May 2018 |
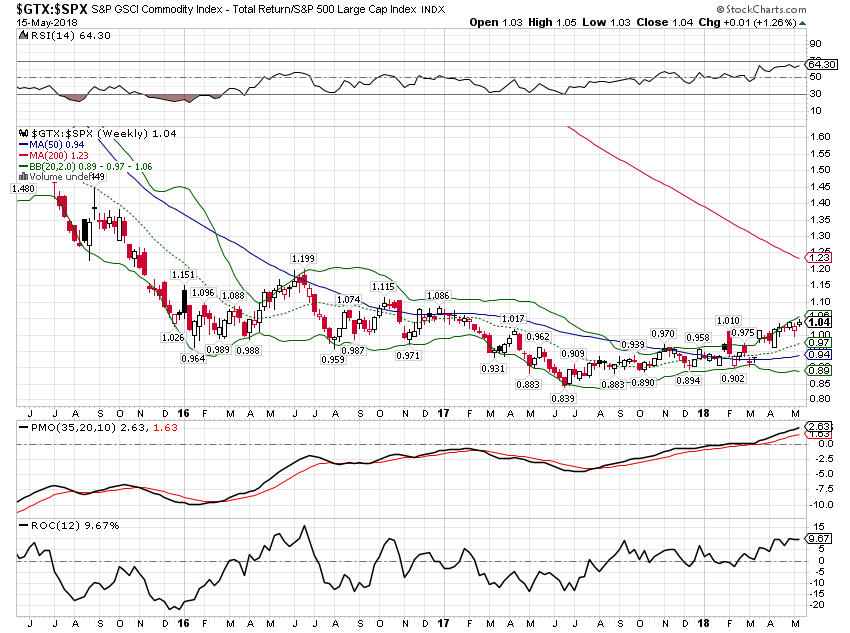
| The commodity indexes have outperformed stocks this year, a continuation of a trend that started last year. The GSCI, in particular has performed very well against the S&P 500. I think this is the beginning of a longer term trend that will be volatile but will continue as long as the dollar remains weak. Currency trends do tend to be persistent which is why I believe the trend will continue but the recent dollar strength is definitely testing my will. |
S&P GSCI Commodity Index Total Return / S&P 500 Large Cap Index, Jun 2015 - May 2018 |
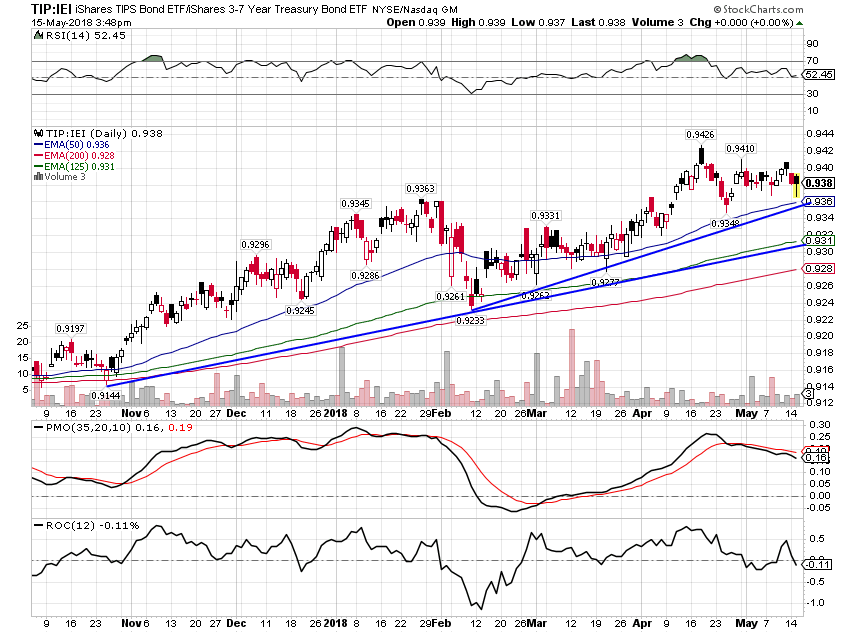
| TIPS continue to outperform nominal Treasuries. |
TIP:IEI Daily, Nov 2017 - May 2018 |
Changes
|
Moderate Allocation |
Tags: Alhambra Research,Asset allocation,Bonds,commodities,credit spreads,currencies,Emerging Markets,Featured,Global Asset Allocation Update,Gold,inflation,Investing,Japan,Market Sentiment,Markets,Model Portfolios,momentum,newsletter,Real Estate,stocks,TIPS,US dollar,valuations,wework,Yield Curve

