There is a fundamental assumption behind any purchasing manager index, or PMI. These are often but not always normalized to the number 50. That’s done simply for comparison purposes and the ease of understanding in the general public. That level at least in the literature and in theory is supposed to easily and clearly define the difference between growth and contraction. But is every 50 the same? That’s ultimately at issue in 2018. The assumption is that a 50 is a 50, and that they are comparable on an apples to apples basis. Behind that postulation is symmetry. We can illustrate the process with some stylized thought experiments. IHS Markit, for example, asks thousands of vetted corporate executives in the second
Topics:
Jeffrey P. Snider considers the following as important: currencies, economic boom, economy, Featured, Federal Reserve/Monetary Policy, IHS Markit, industry, ISM, manufacturing, manufacturing pmi, Markets, newslettersent, PMI, services pmi, The United States, U.S. Gross Domestic Product, U.S. Industrial Production, U.S. Markit Composite PMI
This could be interesting, too:
Nachrichten Ticker - www.finanzen.ch writes Die Performance der Kryptowährungen in KW 9: Das hat sich bei Bitcoin, Ether & Co. getan
Nachrichten Ticker - www.finanzen.ch writes Wer verbirgt sich hinter der Ethereum-Technologie?
Marc Chandler writes March 2025 Monthly
Mark Thornton writes Is Amazon a Union-Busting Leviathan?
There is a fundamental assumption behind any purchasing manager index, or PMI. These are often but not always normalized to the number 50. That’s done simply for comparison purposes and the ease of understanding in the general public. That level at least in the literature and in theory is supposed to easily and clearly define the difference between growth and contraction.
But is every 50 the same? That’s ultimately at issue in 2018. The assumption is that a 50 is a 50, and that they are comparable on an apples to apples basis. Behind that postulation is symmetry.
We can illustrate the process with some stylized thought experiments. IHS Markit, for example, asks thousands of vetted corporate executives in the second half of each and every month whether overall and in particular pieces of their business has it improved, deteriorated, or stayed the same compared to the previous month. We can think, then, of a 50 for the index or subindex as something like 33% saying improved, 33% saying deteriorated, and the last third claiming it’s the same.
It’s intuitive that if from that position the following month 40% are in the improved column because 7% moved out of deteriorated, leaving 26% with that view and still 33% at “the same”, the headline index moving up to 53 would be consistent with actual economic improvement. That part is uncontroversial.
| What’s left out of every calculation is the degree to which something is changing. If we move from 33/33/33 to something like 25/50/25, that’s entirely consistent with the index plunging below 50 and the economy most likely in some state of downturn. And if a few months or a year later the survey results go back to 33/33/33, then the headlines’ return to 50 would be consistent as if things are stabilizing. If it then goes 40/26/33, does that necessarily mean growth has been restored?
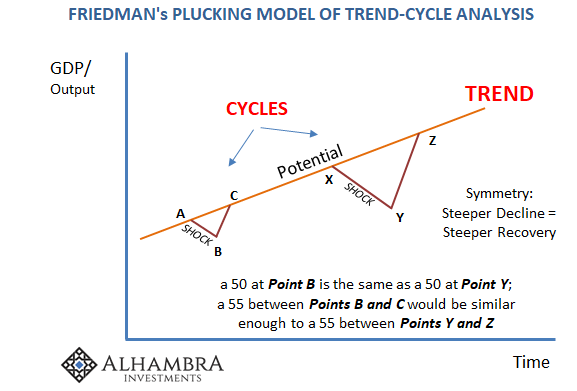
The reason these surveys aren’t more in depth is this implicit idea that when growth is resumed it is resumed at the same general trend as before (symmetry). It’s another one of those mathematical shortcuts (the fewer the variables the better) that when first designed appeared to be trivial because economic history, particularly postwar economic history, had always obeyed symmetry (leading Milton Friedman to confidently assert his “plucking model” in 1993). |
Friedman's Plucking Model of Trend-Cycle |
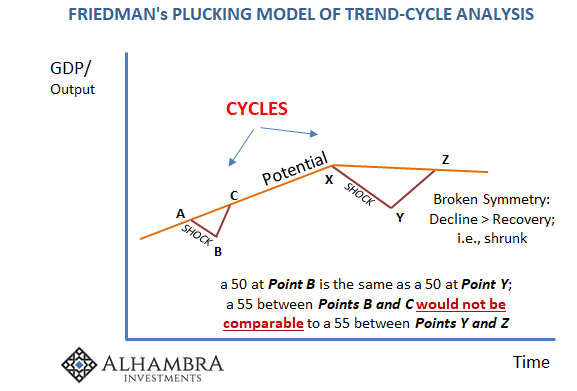
| The last decade has broken all ideas of symmetry, yet 50’s remain undistinguished. What is the state of the economy when going from 33/33/33 = 50 to 25/50/25 < 50 those answering the survey question with “deteriorating” find that deterioration on average to be severe, say 10% or more? In historical terms, that may fall outside of prior experience on the downside, just as the Great “Recession” did for every main statistic.
The real issue is in recovery, or enough recovery, if you will. If going from 25/50/25 < 50 with an average 10% decline in the middle proportion leads to eventually, say, 50/25/25 but this time with only an average 1% gain in the “improving” category, does the resulting index well above 50 really equal the same readings above 50 from before the contraction? No. |
Friedman's Plucking Model of Trend-Cycle |
| We aren’t supposed to worry about those situations because by all modern historical accounts this isn’t possible. The statistical PMI’s were designed for simplicity because it was assumed greater detail among relative changes wasn’t necessary for that reason. |
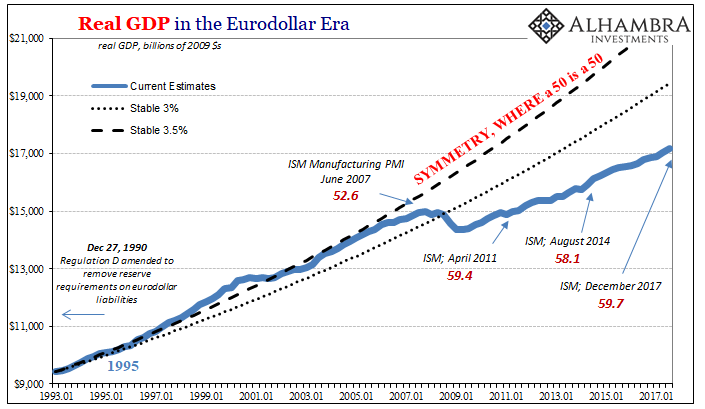
Real GDP in the Eurodollar Era, Jan 1993 - 2018 |
| Using GDP provides us with incontrovertible evidence that symmetry isn’t a given. We know there are cases where asymmetry is possible because there it is (and it’s global), and its presence in GDP data tells us this is an economy-wide problem rather than some industry-specific idiosyncrasy. Obviously, there is much more included in GDP as a proxy for the whole economy than exists in just the manufacturing sector.
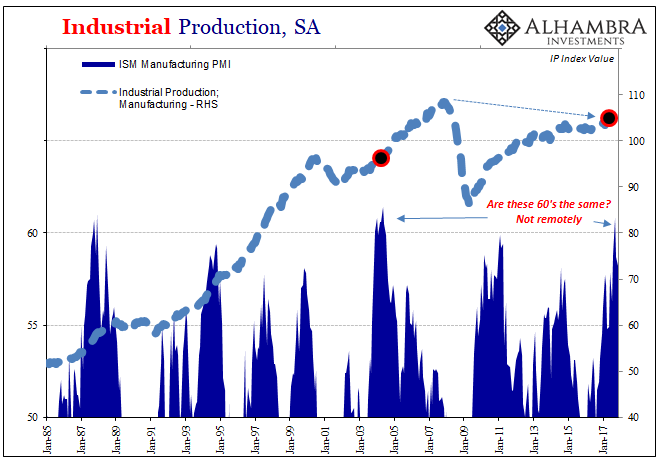
Using the ISM Manufacturing PMI compared instead directly against the Federal Reserve’s Industrial Production data, specifically its manufacturing component, we find unsurprisingly the absence of symmetry there, too. In terms of PMI’s, it has the effect, as described above, of showing why direct PMI comparisons are now tricky if not impossible. The interpretation of these numbers can’t be the same as it once was. In October 2017, the ISM reported a headline PMI calculation that had jumped to 60.8. An index above 60 hasn’t been seen since the middle of 2004. Immediately, the media reported their stories all using the same language about the highest for manufacturing in more than a decade. Manufacturing must be booming. |
US Industrial Production, Jan 1985 - 2018(see more posts on U.S. Industrial Production, ) |
| The IP subindex, however, disabuses any such notion with prejudice. According to the Fed’s far more detailed data, US manufacturing in October (a month provided a large hurricane-assisted boost) was just 8% more than it was when the ISM last indicated 60 thirteen years before. As hard as it may be for some to believe given all the rhetoric about how great the economy has been lately, manufacturing in October, despite a 60 for the ISM, was still 2.6% less than it was in December 2007! In 2017, manufacturing, according to the Fed, increased all of 2.6% (not good) and mostly because of that gain in October.
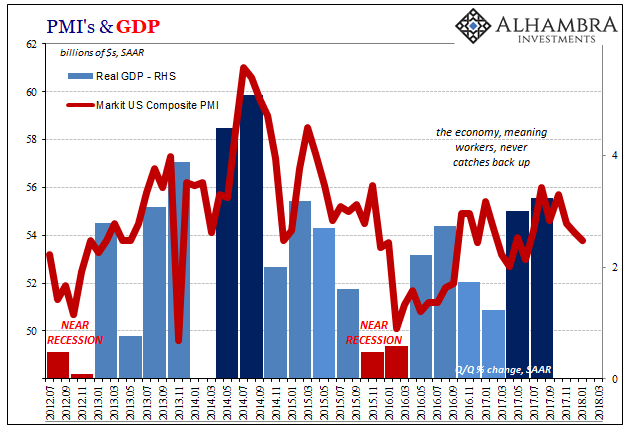
In reference to what I wrote last week, this is a bit less blatant in its dishonesty surrounding the “boom.” PMI’s, very much like the unemployment rate, are not meant for this economy, the one where symmetry was left behind a decade ago. They are simply unable to normalize to the shrinking because they assume right from the start it just isn’t possible. A 50 is a 50, or a 60 a 60, because everyone still believes long run economic trends just don’t all of a sudden break. We know now that they do, yet no one is rushing out to create a new generation of statistics and PMI’s. For that to happen Economists (who prepare these things) would have to admit that Economics itself is fundamentally, perhaps irretrievably, flawed. That’s not happening anytime soon, so this “boom” will go on without any boom. That’s even more the case given what’s happening on the other side of the PMI’s. While manufacturing “sentiment” is up, non-manufacturing sentiment is down. IHS Markit reports today that while its manufacturing index hit a 34-month high of 55.5 (like a lot of things, back to about 2014 levels) its services estimate dropped to a 9-month low (53.3). That brought the composite PMI (a combination of manufacturing plus services) down to an 8-month low of just 53.8, a number that has been recently much closer to downturn than upturn. |
US Markit Composite PMI and GDP, Jun 2012 - Jan 2018(see more posts on U.S. Gross Domestic Product, U.S. Markit Composite PMI, ) |
Regardless of symmetry considerations, that would appear to indicate a general slowing in the US economy to end 2017 and begin 2018 (from an already lowered starting point).
In other words, it’s a boom that isn’t a boom doing less while not booming. They call Economics the “dismal science” for the wrong reasons; it’s not a science, but it is a miserable excuse for one.
Tags: currencies,economic boom,economy,Featured,Federal Reserve/Monetary Policy,IHS Markit,industry,ism,manufacturing,manufacturing pmi,Markets,newslettersent,PMI,services pmi,U.S. Gross Domestic Product,U.S. Industrial Production,U.S. Markit Composite PMI

