Tightening Credit Markets Daylight extends a little further into the evening with each passing day. Moods ease. Contentment rises. These are some of the many delights the northern hemisphere has to offer this time of year. As summer approaches, and dispositions loosen, something less amiable is happening. Credit markets are tightening. The yield on the 10-Year Treasury note has exceeded 3.12 percent. If yields continue to rise, this one thing will change everything. To properly understand the significance of rising interest rates some context is in order. Where to begin? In 1981, professional skateboarder Duane Peters was busy inventing tricks like the invert revert, the acid drop, and the fakie thruster, in
Topics:
MN Gordon considers the following as important: 6) Gold and Austrian Economics, 6b) Austrian Economics, Central Banks, Credit Markets, Featured, newsletter
This could be interesting, too:
Nachrichten Ticker - www.finanzen.ch writes Die Performance der Kryptowährungen in KW 9: Das hat sich bei Bitcoin, Ether & Co. getan
Nachrichten Ticker - www.finanzen.ch writes Wer verbirgt sich hinter der Ethereum-Technologie?
Martin Hartmann writes Eine Analyse nach den Lehren von Milton Friedman
Marc Chandler writes March 2025 Monthly
Tightening Credit MarketsDaylight extends a little further into the evening with each passing day. Moods ease. Contentment rises. These are some of the many delights the northern hemisphere has to offer this time of year. As summer approaches, and dispositions loosen, something less amiable is happening. Credit markets are tightening. The yield on the 10-Year Treasury note has exceeded 3.12 percent. If yields continue to rise, this one thing will change everything. To properly understand the significance of rising interest rates some context is in order. Where to begin? In 1981, professional skateboarder Duane Peters was busy inventing tricks like the invert revert, the acid drop, and the fakie thruster, in empty Southern California swimming pools. As part of his creative pursuits, he refined and perfected the art of self-destruction with supreme enthusiasm. His many broken bones, concussions, and knocked out teeth earned him the moniker, “The Master of Disaster”. But as The Master of Disaster was risking life and limb while pioneering the loop of death, the seeds of a mega-disaster were being planted. In particular, the rising part of the interest rate cycle peaked out in 1981. Then, over the next 35 years, interest rates fell and these seeds of mega-disaster were multiplied and scattered across the land. |
10 Year Treasury Note Yield, Jun 2015 - May 2018There is a fly in the ointment for treasury bears though: the net speculative short position in futures across the yield curve is seemingly establishing new record highs every week. While this is not bullish for treasuries per se, it definitely makes yields vulnerable to a sharp pullback. The question is what might cause such a pullback. Our guess would be that either “unexpected economic weakness” will enter the scene, or crisis conditions in emerging markets will worsen and eventually spark “flight to safety” behavior. |
Credit and Asset PricesThe relationship between interest rates and asset prices is generally straightforward. Tight credit generally results in lower asset prices. Loose credit generally results in higher asset prices. When credit is cheap, and plentiful, individuals and businesses increase their borrowing to buy things they otherwise couldn’t afford. For example, individuals, with massive jumbo loans, bid up the price of houses. Businesses, flush with a seemingly endless supply of cheap credit, borrow money and use it to buy back shares of their stock… inflating its value and the value of executive stock options. When credit is tight, the opposite happens. Borrowing is reserved for activities that promise a high rate of return; one that exceeds the high rate of interest. This has the effect of deflating the price of financial assets. In 1981, credit was expensive, while stocks, bonds, and real estate were cheap. For example, in 1981, the interest rate on a 30-year fixed mortgage reached a high of 18.63 percent. That year, the median sales price for a U.S. house was about $70,000. |
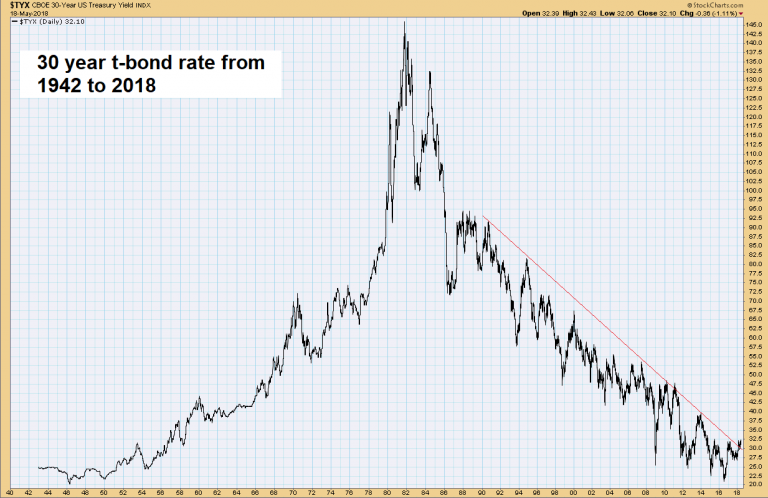
30 Year T-bond Rate, 1942 - 2018The recent move higher probably is not a breakout just yet – this depends a bit on how one draws the resistance line on the chart. One has to keep in mind that any upcoming decline in yields is likely to occur in conjunction with negative news on the economic front. It could well be that the current level of yields is already more than the economy can bear (per experience this level becomes lower the larger the debtberg becomes). Yields have nevertheless reached a level that is very close to a definitive breakout. We are a bit reluctant to read too much into it, mainly because it always looks very convincing when yields start to move higher (see the past occasions on the chart above). We think a real change of character in the market will require clearly discernible higher highs in yields – which may of course be in store. |
| Today, the interest rate on a 30-year fixed mortgage is about 4.5 percent. And the median price of a U.S. house is now about $330,000. Along the Country’s east and west coasts, prices are much higher.
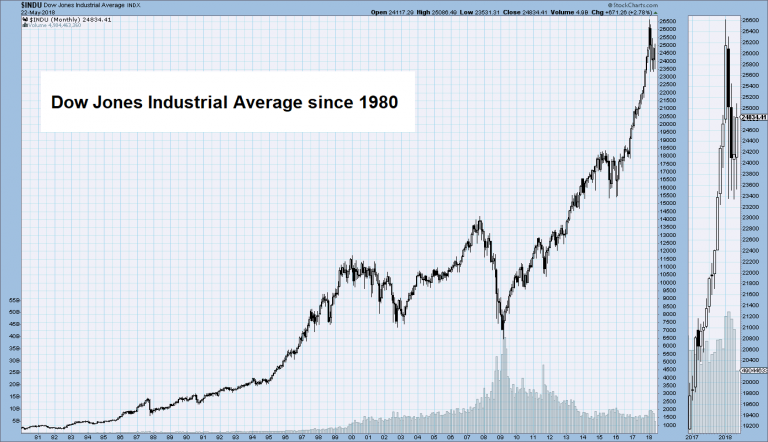
Similarly, the Dow Jones Industrial Average (DJIA) was roughly 900 points in 1981. Today, the DJIA is about 24,700 points. That comes to over a 2,600 percent increase. Yet over this same period, nominal gross domestic product has only increased by roughly 500 percent. We suspect a 35-year run of cheaper and cheaper credit had something to do with ballooning stock and real estate prices. Asset prices and other financialized costs, like college tuition, have been grossly distorted and deformed by three decades of cheap credit. The disparity between high asset prices and low borrowing costs, have positioned the world for an epic mega-disaster. The Federal Reserve has an extreme and heavy handed influence over credit markets. But they are not the masters of it. The fact is, Fed credit market intervention plays second fiddle to the overall rise and fall of the interest rate cycle. From a historical perspective, today’s 10-Year Treasury note yield of 3.12 is still extraordinarily low. But if you consider just the last two years, it is extraordinarily high. The yield on the 10-Year Treasury note bottomed out at just 1.34 percent in early-July 2016. At 3.12 percent today, the yield his increased dramatically. In fact, the yield on the 10-Year Treasury note has increased over 130 percent over the last 22 months. |
Dow Jones Industrial Average, 1980 - 2018 The DJIA since 1980. It is probably fair to call this the mother of all bubbles by now. - Click to enlarge If one looks at a very long term log chart of the average, there are only three time periods over the past century that have seen comparably rapid and large price increases: 1922-1929, 1982 – 1987 and 2009 – 2018. However, the latter time period has generated the most pronounced overbought readings, the greatest valuation extremes and arguably new records in terms of complacency among market participants (admittedly there are far more ways to measure sentiment today than there used to be, many data series cannot be compared with those of past asset bubbles because they didn’t exist at the time). |
Tales from “The Master of Disaster”The last time the interest rate cycle bottomed out was during the early-1940s. The low inflection point for the 10-Year Treasury note at that time was a yield somewhere around 2 percent. After that, interest rates generally rose for the next 40 years. What hardly a living soul remembers is that the Federal Reserve’s adjustments to the federal funds rate have drastically different effects during the rising part of the interest rate cycle than during the falling part of the interest rate cycle. Between 1981 and 2016, each time the economy went soft, the Fed cut interest rates to stimulate demand. In this disinflationary environment, the credit markets limited the negative consequences of the Fed’s actions. Certainly, asset prices increased and incomes stagnated. But consumer prices did not completely jump off the charts. The Fed took this to mean that it had tamed the business cycle. This couldn’t be further from the truth. During the rising part of the interest rate cycle, as demonstrated in the 1970s, after the U.S. defaulted on the Bretton Woods Agreement, Fed interest rate policy becomes increasingly disastrous. Fed policy makers are politically incapable of staying out in front of rising interest rates. Their efforts to hold the federal funds rate artificially low, to boost the economy, no longer have the desired effect. In this scenario, monetary inflation breeds consumer price inflation. Fed policies become policies of disaster. It seems possible that in July 2016, roughly 35 years after it last peaked, the credit market finally bottomed out. Yields are rising again. In truth, they may well rise for the next three decades. This means the price of credit will become increasingly more expensive into the mid-21st century. Hence, the world of perpetually falling interest rates – the world we’ve known since the early days of the Reagan administration – is over. But what about The Master of Disaster, Duane Peters? Well, Duane, you see. He’s a true iconoclast. He is much more stubborn than the credit market. At age 55, he continues to pursue disaster with the relentless composure of a fly smashing into a kitchen window. He also does so while refusing to wear a helmet, and while regularly cracking his skull open on the concrete. Yet, somehow, he keeps on going. The Federal Reserve and the dollar, however, don’t stand a chance. The rising part of the credit cycle will be their death knell. But first, rising interest rates and deflating asset prices will wreak havoc and disaster on the world at large. It won’t be pretty. It will be painful. Our advice: Make like The Master of Disaster. Take your lumps, and keep on going. |
Charts by: StockCharts
Chart and image captions by PT
Tags: central banks,Credit Markets,Featured,newsletter


