Oil prices are weaker for the third straight day and are off in four of the past five sessions, the poorest run in two months. Supply considerations may threaten a year-old trend line. OPEC and non-OPEC, essentially Saudi Arabia and Russia are making good on their commitment to boost output, and US oil inventories unexpectedly rose. Saudi output appears to have risen by about 230k barrels per day. Production in Nigeria and Iraq also edged up. Russia’s output reportedly increased by almost 150 mln bpd, bringing it to 11.21 mln bpd, and not far from record levels. Surveys suggested US oil inventories had fallen by around 3 mln barrels, but instead, EIA reported a 3.8 mln build. US inventories are gradually being drawn
Topics:
Marc Chandler considers the following as important: 4) FX Trends, Featured, Great Graphic, newsletter, Oil
This could be interesting, too:
Nachrichten Ticker - www.finanzen.ch writes Die Performance der Kryptowährungen in KW 9: Das hat sich bei Bitcoin, Ether & Co. getan
Nachrichten Ticker - www.finanzen.ch writes Wer verbirgt sich hinter der Ethereum-Technologie?
Martin Hartmann writes Eine Analyse nach den Lehren von Milton Friedman
Marc Chandler writes March 2025 Monthly
Oil prices are weaker for the third straight day and are off in four of the past five sessions, the poorest run in two months. Supply considerations may threaten a year-old trend line.
OPEC and non-OPEC, essentially Saudi Arabia and Russia are making good on their commitment to boost output, and US oil inventories unexpectedly rose. Saudi output appears to have risen by about 230k barrels per day. Production in Nigeria and Iraq also edged up. Russia’s output reportedly increased by almost 150 mln bpd, bringing it to 11.21 mln bpd, and not far from record levels.
Surveys suggested US oil inventories had fallen by around 3 mln barrels, but instead, EIA reported a 3.8 mln build. US inventories are gradually being drawn down. The pace accelerated over the last couple of months. The dynamics in the US oil market and the meaning of the inventory changes are being transformed by a dramatic increase in energy trade. Crude inventory in Cushing, a key delivery point, has fallen for 11 consecutive weeks, and this follows a nine-week liquidation run to start the year.
A recent report by the EIA highlight relatively low levels of distillates, which include heating oil and diesel. Domestic demand for diesel was to increased truck traffic and is apparently not being matched by increased refinery production or reduced exports. That said, refinery distillate output is running about 1% higher year-over-year in H1. The slowing of net exports in H1 was a function of increased heating oil imports in the first part of the year.
The determination of Saudi Arabia and Russia to boost output to restrain prices is driven by self-interest. The market learns to respect that determination, but it often takes some time. Investors also realize that there are capacity constraints and political considerations that also limit how far this strategy can be pushed. Meanwhile, the US is not peak production. Fixed capital investment has been concentrated in the sector, which not only speaks to the growing capacity but also the introduction of efficiencies that low production costs.
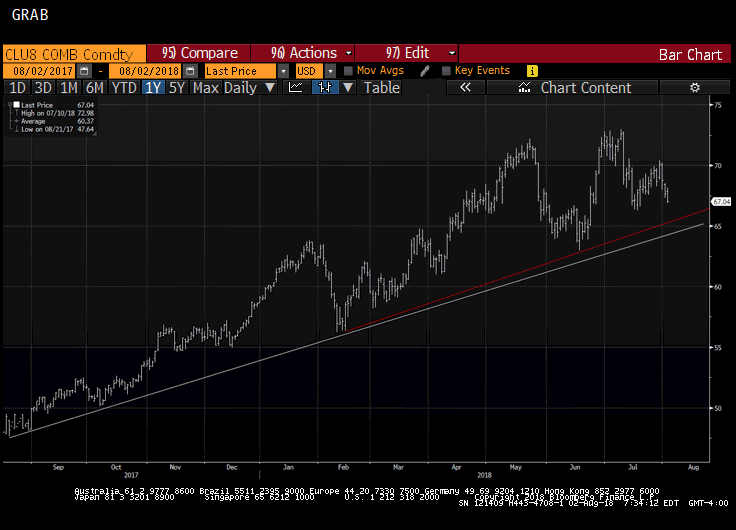
| The Great Graphic of the September light sweet futures contract shows a trendline from a year ago (white line) that comes in now near $64.30. There is another trendline (red line) drawn from this year’s low. It is found near $65.30. The contract is currently trading near $67.30, which is also the 20-week moving average. It has not closed below this average in a year. A close tomorrow below $67.55, last week’s low will confirm a bearish outside week. The first round of US sanctions against Iran go into effect this weekend, but the energy embargo starts in November.
A further breakdown in oil prices may help convince investors that a high of some importance may be in place. There are two medium-term technical considerations. First, a double top may be in place in late May and early July above $72-$73. The neckline is late June low near $63. A break of that low would suggest a potential pullback toward $53-$54. Second, is the retracement of the rally that began last June, when oil was a little below $46 a barrel. The 38.2% retracement is slightly below the neckline at $62.50. The 50% retracement is near $59.30, and the 61.8% retracement is $56, the February low. |
Crude Oil, Sep 2017 - Aug 2018 |
Tags: Featured,Great Graphic,newsletter,OIL

