Crude oil has been climbing a trendline for the past year. This Great Graphic depicts this trend on a weekly bar chart. Depending exactly the line is drawn, it comes in now near a barrel. The technical indicators are consistent with further losses. Oil is off for a third day, alongside other industrial commodities, including copper. In addition to concerns about the economic impact from the trade tensions, the world’s three largest producers are committed to boosting output, even though there is some fluctuation in high-frequency data, not all of which are confirming a continued rise in production. API estimates that US oil inventories rose 3.66 mln barrels last week. The Bloomberg survey for the government’s
Topics:
Marc Chandler considers the following as important: 4) FX Trends, Featured, Great Graphic, newsletter, Oil
This could be interesting, too:
Nachrichten Ticker - www.finanzen.ch writes Die Performance der Kryptowährungen in KW 9: Das hat sich bei Bitcoin, Ether & Co. getan
Nachrichten Ticker - www.finanzen.ch writes Wer verbirgt sich hinter der Ethereum-Technologie?
Martin Hartmann writes Eine Analyse nach den Lehren von Milton Friedman
Marc Chandler writes March 2025 Monthly
| Crude oil has been climbing a trendline for the past year. This Great Graphic depicts this trend on a weekly bar chart. Depending exactly the line is drawn, it comes in now near $65 a barrel. The technical indicators are consistent with further losses.
Oil is off for a third day, alongside other industrial commodities, including copper. In addition to concerns about the economic impact from the trade tensions, the world’s three largest producers are committed to boosting output, even though there is some fluctuation in high-frequency data, not all of which are confirming a continued rise in production. API estimates that US oil inventories rose 3.66 mln barrels last week. The Bloomberg survey for the government’s estimate was for a 2.9 mln barrel drawdown. API also reported the largest jump in the Cushing supply, 1.64 mln, in five months. The EIA data is sought for confirmation. The Bloomberg survey found a median expectation for a 500k build, which would snap a 12-week liquidation phase. |
Crude Oil Weekly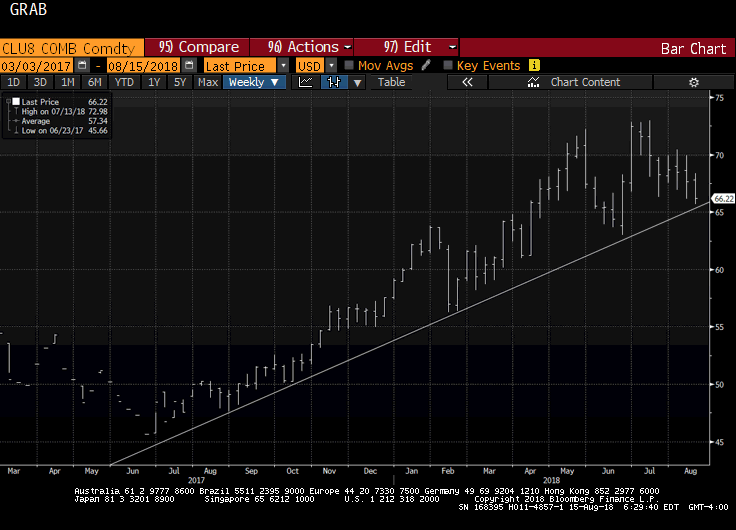 - Click to enlarge |
Although the US embargo against Iranian oil will not be implemented until November, there is already some indication that preparations are beginning to bite. Reports today suggest, for example, that Iranian oil and condensate shipments to India have all stopped over the past couple of week, down 95% from the first half of July. This may exaggerate the stoppage. India is reportedly considering a 50% cut in Iranian oil imports in a bid to get a waiver from the US. Iranian oil shipments to China slowed in the first two weeks of August (-27%).
Although EU purchases of Iranian oil was unchanged, the buyers changed. Shipments to Spain stopped (from 214k barrels in the first half of July), while Italian purchases jumped from 71k barrels to 286k barrels. Japan also took in a bit more Iranian oil (190k barrels vs. 119k barrels).
Near-term, a convincing break of $66 could see a test on the lows from June in the $63-$64 area. The $62.50 area basis the September crude oil contract is the 38.2% retracement of the rally that began last summer from near $46 a barrel. The 50% retracement is just below $59.50.
Click here to see earlier post on oil.
Tags: Featured,Great Graphic,newsletter,OIL