See the introduction and the video for the terms gold basis, co-basis, backwardation and contango. The Socialist Politician-Bureaucrat with the Worst Timing Ever As most in the gold community know, the UK Chancellor of the Exchequer Gordon Brown announced on 7 May, 1999 that HM Treasury planned to sell gold. The dollar began to rise, from about 110mg gold to 120mg on 6 July, the day of the first sale. This translates into dollarish as: gold went down, from 2 to 8. It makes sense, as the UK was selling a lot of gold… or does it? We won’t get into the theories of his motivation. However, we note that if he wanted to — pardon the dollarish — push down gold, he was not particularly effective. He squandered half
Topics:
Keith Weiner considers the following as important: Chart Update, Featured, Gold and its price, Gold and silver prices, gold basis, Gold co-basis, gold silver ratio, newslettersent, Precious Metals
This could be interesting, too:
Nachrichten Ticker - www.finanzen.ch writes Die Performance der Kryptowährungen in KW 9: Das hat sich bei Bitcoin, Ether & Co. getan
Nachrichten Ticker - www.finanzen.ch writes Wer verbirgt sich hinter der Ethereum-Technologie?
Marc Chandler writes March 2025 Monthly
Mark Thornton writes Is Amazon a Union-Busting Leviathan?
See the introduction and the video for the terms gold basis, co-basis, backwardation and contango.
The Socialist Politician-Bureaucrat with the Worst Timing EverAs most in the gold community know, the UK Chancellor of the Exchequer Gordon Brown announced on 7 May, 1999 that HM Treasury planned to sell gold. The dollar began to rise, from about 110mg gold to 120mg on 6 July, the day of the first sale. This translates into dollarish as: gold went down, from $282 to $258. It makes sense, as the UK was selling a lot of gold… or does it? We won’t get into the theories of his motivation. However, we note that if he wanted to — pardon the dollarish — push down gold, he was not particularly effective. He squandered half of Britain’s gold to get the price to drop 8.5%. That lasted but a few months. By the end of September, the price was not only back up to $282 but rising rapidly on its way past $320. Then it came down with volatility, rose, slowly fell to just under $260 about two years later. The price bottom just about coincides with the end of his selling. This is history, and it’s been discussed and analyzed many times. What has not been seen until now is a look at the gold basis and co-basis during this time. Was gold becoming abundant due to selling? Or did something else happen? |
 - Click to enlarge |
An Excellent Trading OpportunityHere is a graph showing the continuous gold basis and co-basis, overlaid with the price of the dollar. Several features are noteworthy:
We believe this confirms our view that there is a lot of gold out there. This was as clear a case of short selling as can be. Brown wasn’t even selling yet, and the market price was driven down 8.5%. Actually, the market price began falling before the announcement, which suggests that privileged information may have leaked. Yet the market makers handled this with aplomb. The basis moved, but not that much. |
Gold Basis And Cobasis Continuos, April 1999 - December 1999(see more posts on gold basis, Gold co-basis, ) - Click to enlarge |
Wait… Brown is selling large quantities of gold and yet gold is become less abundant and scarcer, peaking at significant scarcity indeed? Selling physical metal should — all else being equal — cause it to become more abundant. But it didn’t. It’s appropriate to quote Sir Arthur Conan Doyle here (doubly so, as Keith is in London at the moment):
Those fool speculators thought they could short gold with impunity. After all, the price dropped. A major country was selling in quantity. We assume the charts painted a bearish picture. Even some gold bugs may have thought that with major governments against them, the price could be driven down even further. This was the end of a long period of a falling gold price. Sentiment must have been in the pits.
If you were watching the basis, you would have seen this move coming. Here is a graph of our fundamental price, zoomed in to show just a small window around the price explosion. |
Gold Market Bid Price And Gold Price Fundamental, August 1999 - October 1999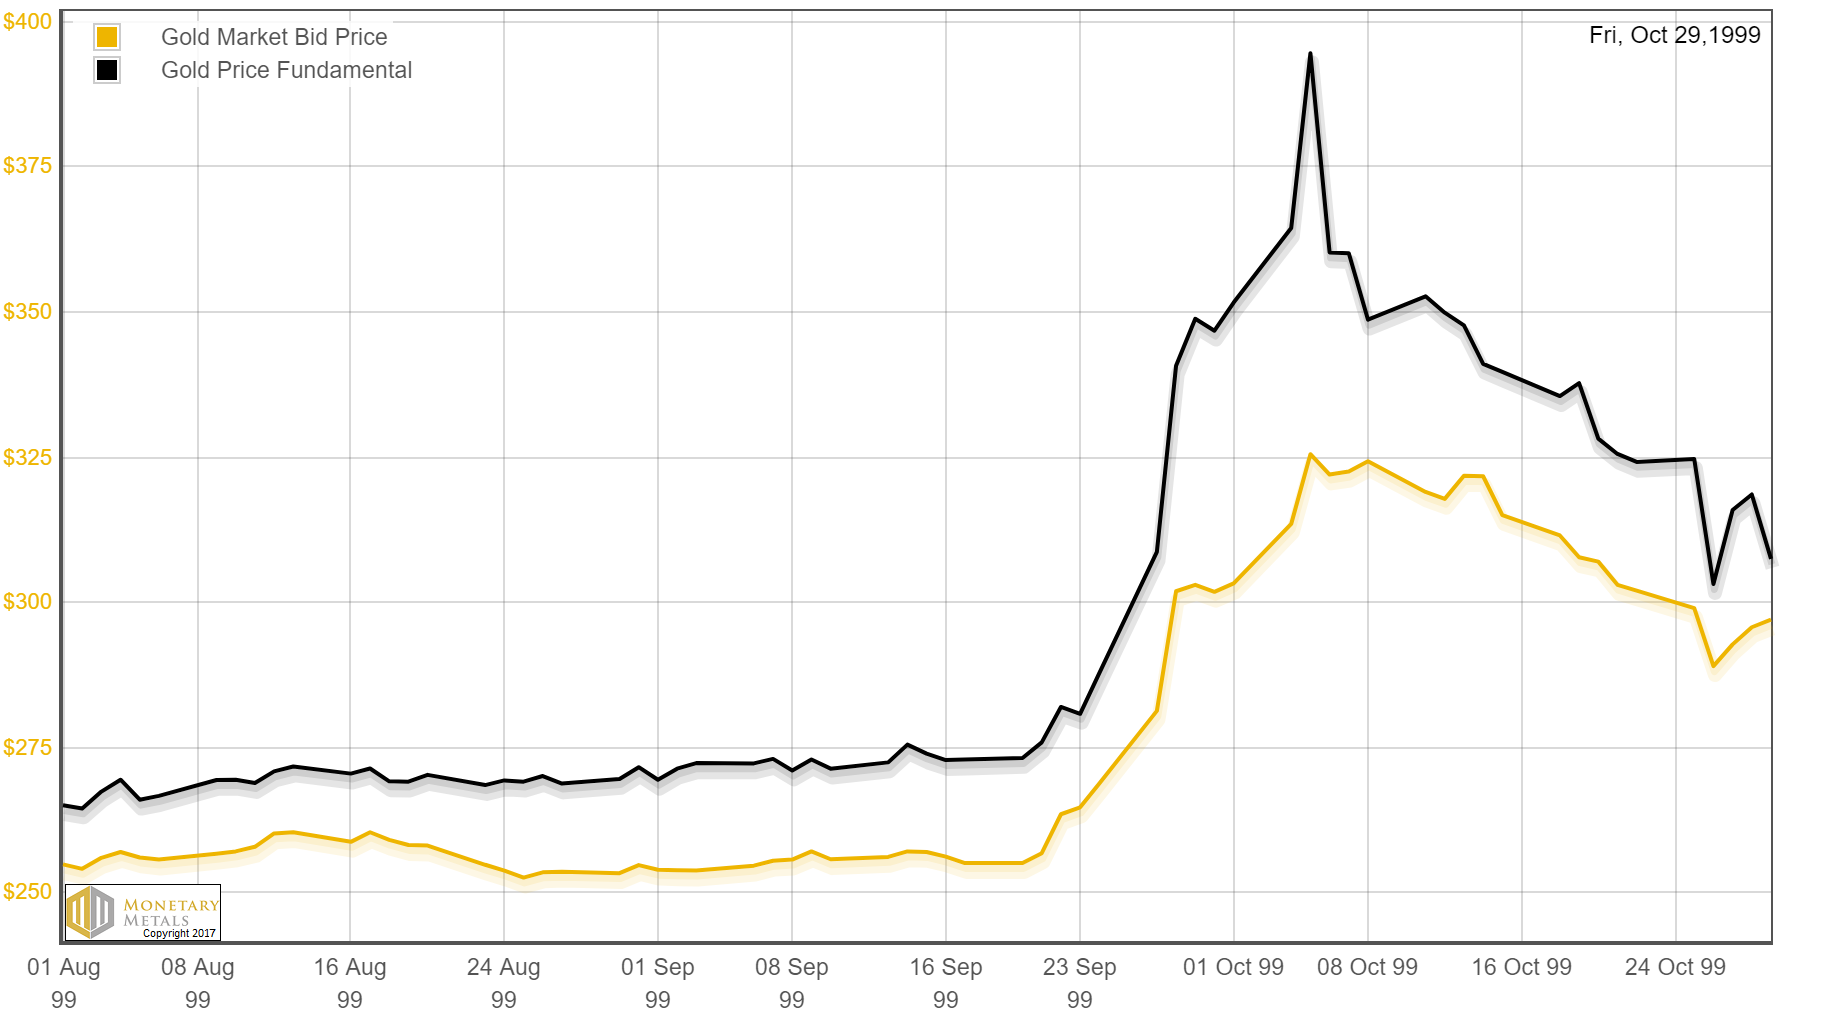 - Click to enlarge |
| The difference between the fundamental and market prices gives us the premium or discount. Here is a graph of that for the same time period.
You might have traded before the fundamental price moved decisively based on the basis graph. In any case, by 27 September the fundamental price was up sharply and the market price was still only $281. You might have closed the trade when the price hit $325 by 5 Oct. A week later, and you had a 16% gain. The fundamental price by itself would still have gotten you out of the trade. By 14 Oct, it had overshot and come back down and was clearly falling. The exit price was only $4 lower that day, $321. Daily updated charts of the basis, both near contract and continuous, fundamental, and premium/discount are available on our website. |
Fundamental Versus Market Price, August 1999 - October 1999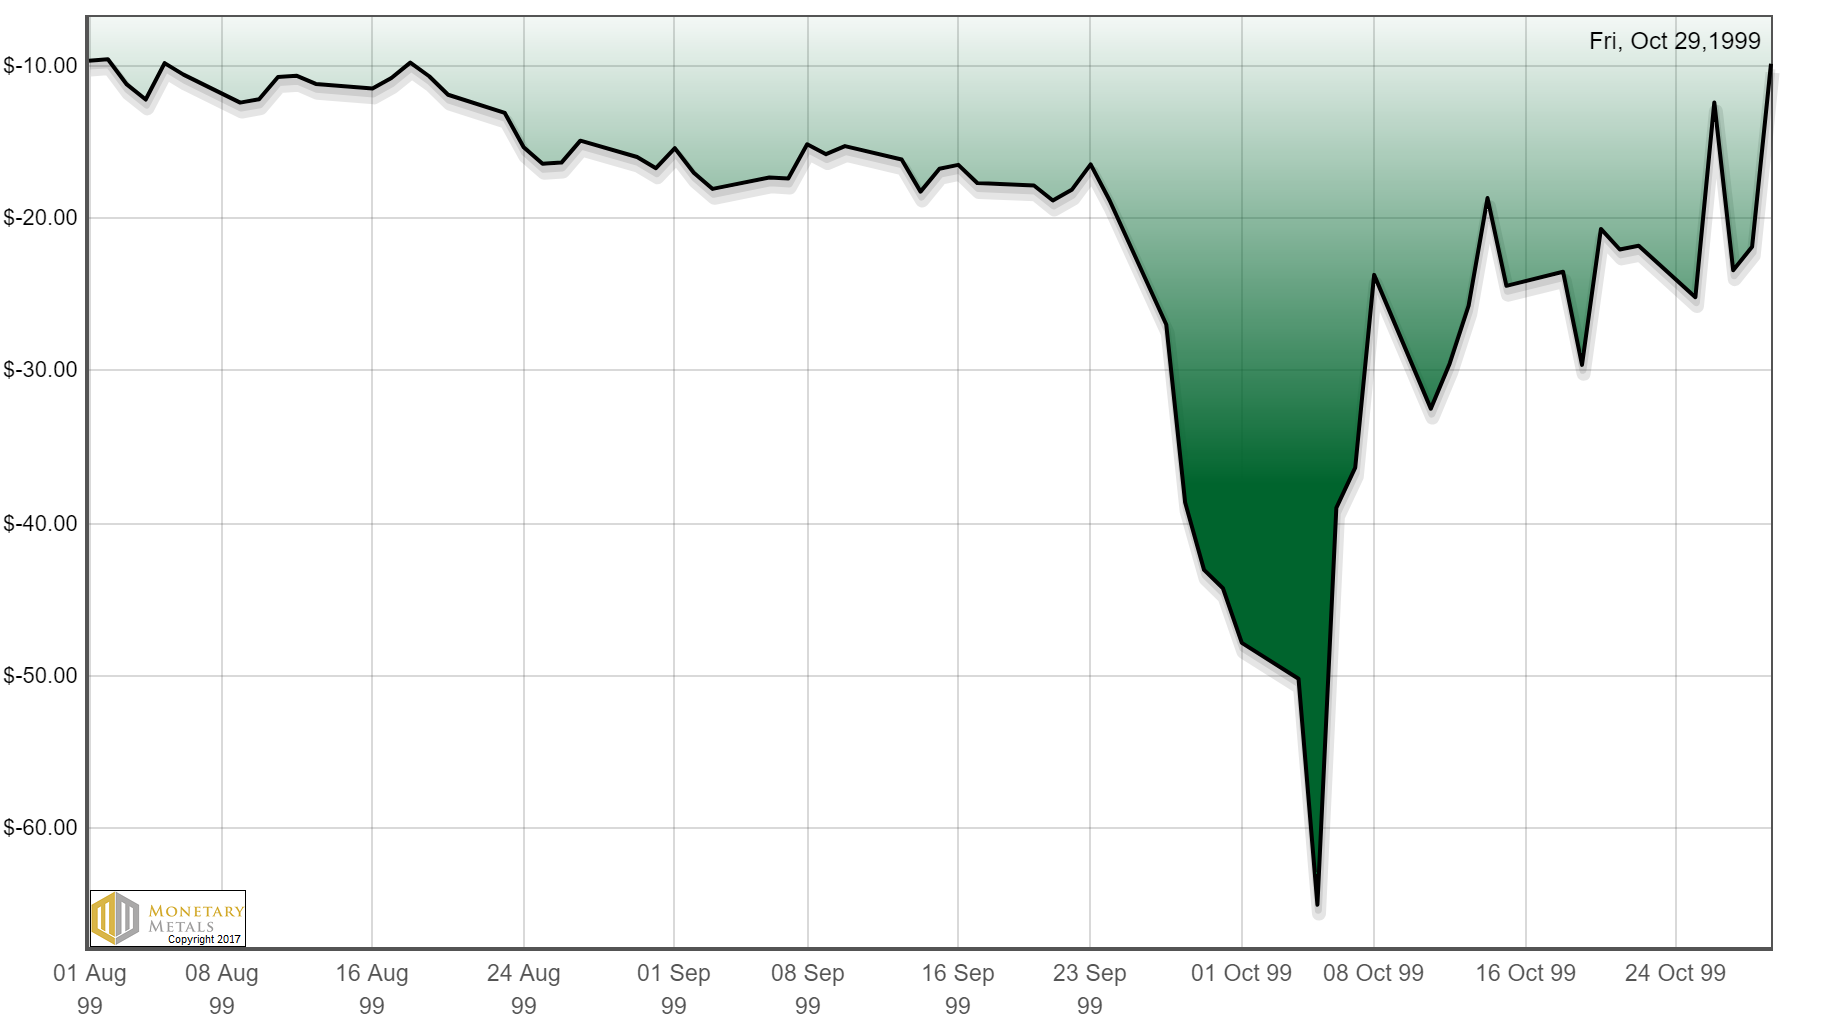 - Click to enlarge |
No Linear RelationshipThere is one other thing worth mentioning. Linear thinking may be tempting and convenient. However, we see here that Brown set something in motion. A linear view would ask how much price drop to expect for a given quantity of gold. Like draining a tank of liquid, how much will the level drop for a gallon pumped out? That is not what happened. This is more like a resonant system. Brown jerked on a spring. He set it in motion, reverberating for quite some time. And the price ended up moving higher, both in the short term (4 ½ months later) and long term (a bull market that went for a decade, and took the price up more than 6 ½ times). Obviously, many buyers increased their purchases of gold perhaps in response to the drop in price. New buyers came into the market. Perversely, in a world where central banks are selling their gold—literally debasing their currencies—there is more reason to own gold. A linear model like supply and demand curves cannot explain what happened (or predict what will happen). Virtually all of the gold mined over thousands of years is potential supply, at the right price and under the right conditions. Everyone is potential demand, at the right price and under the right conditions. Brown had a modest effect on price, but he perturbed the market and that changed the conditions. The other sellers of gold (metal, not futures contracts) decided they might rather not sell and/or buyers stepped up their purchases. Ironically, it could even have been the British, who had been happy to own pounds knowing that each pound represented a certain amount of gold backing. Brown’s move convinced them to buy the gold, and he ended up simply shifting gold to the people. This is just conjecture, but it would fit. Fundamental DevelopmentsLast week, the prices of the metals fell. However, with all the previous discussion, we are sure you want to see the fundamentals of supply and demand. |
Gold And Silver Prices, January 2017 - June 2017(see more posts on Gold and silver prices, )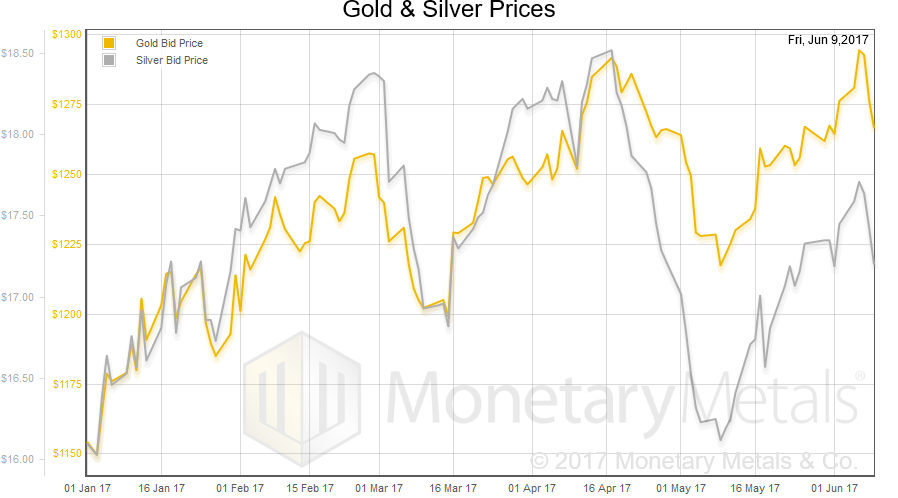 - Click to enlarge |
Next, this is a graph of the gold price measured in silver, otherwise known as the gold to silver ratio. It moved up a bit.
|
Gold: Silver Ratio, January 2017 - June 2017(see more posts on gold silver ratio, )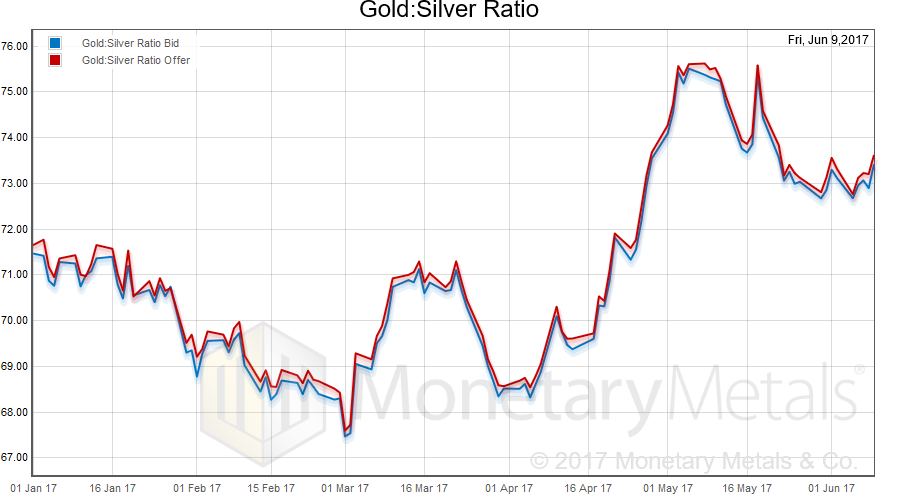 - Click to enlarge |
Here is the gold graph. |
Gold Basis, January 2017 - June 2017(see more posts on gold basis, )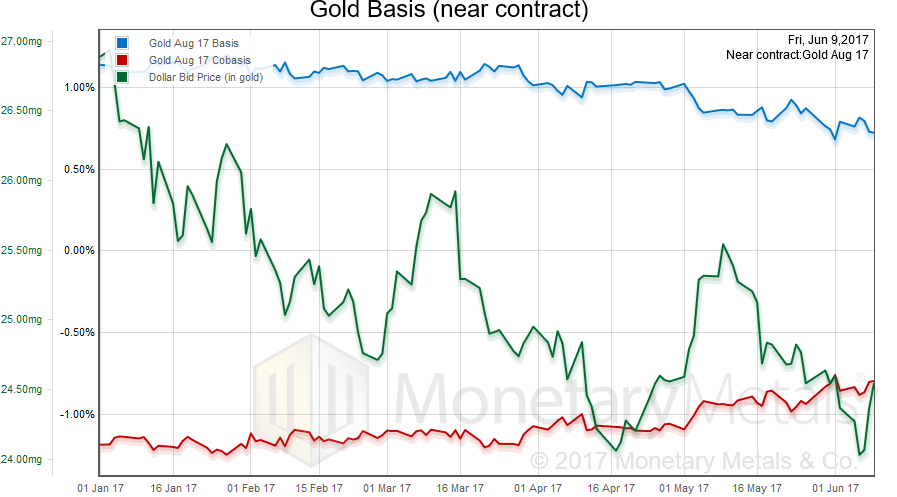 - Click to enlarge |
| We had a rising price of the dollar (the mirror image of the dropping price of gold), and a slightly falling abundance (the basis) and slightly rising scarcity (the co-basis).
Our gold fundamental price shows a decrease of $10 (to $1,324). Now let’s look at silver. In silver terms, the dollar rose more (i.e., the price of silver fell more). The metal became less abundant and scarcer. Our silver fundamental price shows a decrease of 11 cents (to $17.52). |
Silver Basis, January 2017 - June 2017(see more posts on silver basis, )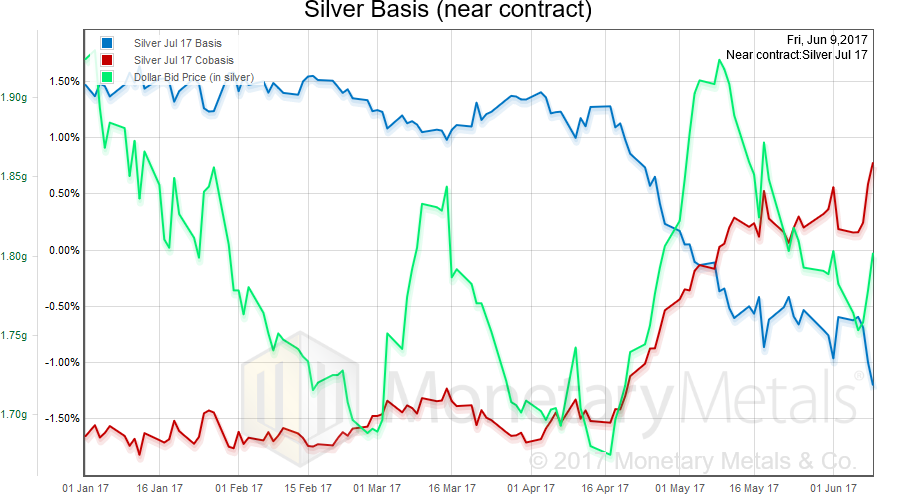 - Click to enlarge |
Tags: Chart Update,Featured,Gold and silver prices,gold basis,Gold co-basis,gold silver ratio,newslettersent,Precious Metals