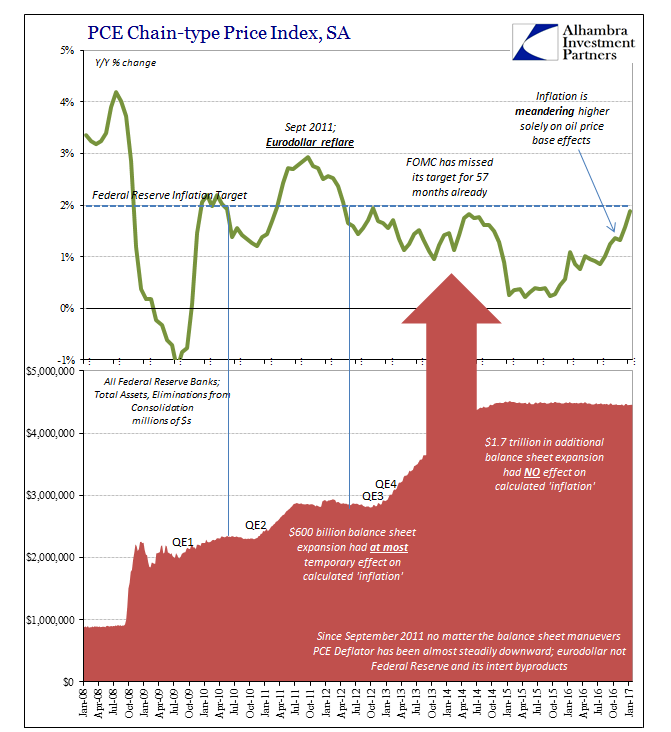
The PCE Deflator for January 2017 rose just 1.89% year-over-year. It was the 57th consecutive month less than the 2% mandate (given by the Fed itself when in early 2012 it made the 2% target for this metric its official definition of price stability). Though there is a chance that the streak will end with the update for February, it should not go unnoticed how weak that number is given that oil prices in January were up an average of 65% over January 2016. If the Fed doesn’t seem like it is at all concerned about inflation, that is because they know it just isn’t there beyond these base commodity effects. If oil doesn’t rise by a lot very soon, the stay of the PCE Deflator, as well as that for the CPI, above 2% will be a short one. PCE Chain-type Price Index 2008-2017 - Click to enlarge As oil prices remain as they are in relation to where they were one year ago, measured inflation rates have come back up, some faster than others. This does mimic the real world situation where consumers are paying more now for gasoline than they did last year. Even though they are paying less than three years ago for the same product, annual statistics are focused solely on the annual time frame even though more forthright economic analysis recognizes both comparisons.
Topics:
Jeffrey P. Snider considers the following as important: Consumer Prices, consumer spending, CPI, currencies, department stores, depression, disposable personal income, earnings, economy, Featured, Federal Reserve/Monetary Policy, macro, Markets, newslettersent, nonstore retailers, oil prices, PCE, pce deflator, Personal Consumption Expenditures, price sensitivity, real disposable personal, real pce, Retail sales, Target, The United States, wages
This could be interesting, too:
Nachrichten Ticker - www.finanzen.ch writes Die Performance der Kryptowährungen in KW 9: Das hat sich bei Bitcoin, Ether & Co. getan
Nachrichten Ticker - www.finanzen.ch writes Wer verbirgt sich hinter der Ethereum-Technologie?
Marc Chandler writes March 2025 Monthly
Mark Thornton writes Is Amazon a Union-Busting Leviathan?
| The PCE Deflator for January 2017 rose just 1.89% year-over-year. It was the 57th consecutive month less than the 2% mandate (given by the Fed itself when in early 2012 it made the 2% target for this metric its official definition of price stability). Though there is a chance that the streak will end with the update for February, it should not go unnoticed how weak that number is given that oil prices in January were up an average of 65% over January 2016. If the Fed doesn’t seem like it is at all concerned about inflation, that is because they know it just isn’t there beyond these base commodity effects. If oil doesn’t rise by a lot very soon, the stay of the PCE Deflator, as well as that for the CPI, above 2% will be a short one. |
PCE Chain-type Price Index 2008-2017 |
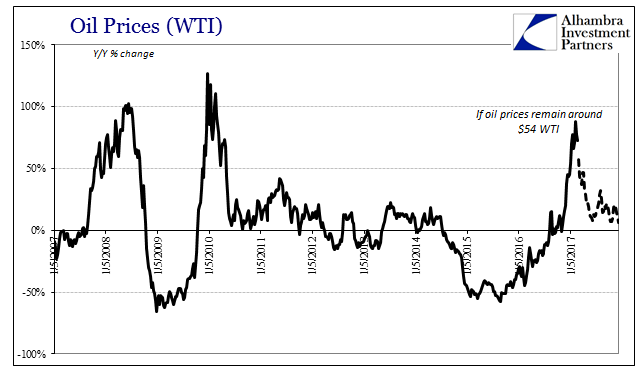
| As oil prices remain as they are in relation to where they were one year ago, measured inflation rates have come back up, some faster than others. This does mimic the real world situation where consumers are paying more now for gasoline than they did last year. Even though they are paying less than three years ago for the same product, annual statistics are focused solely on the annual time frame even though more forthright economic analysis recognizes both comparisons. |
Oil Prices 2007-2017 |
| The lack of uninterrupted acceleration in the PCE Deflator is indicative of the same in the real economy. As has been the case for months now, the increase in the measured rate of inflation is almost in total a subtraction for real variables like spending and income. Nominally, both income and spending remain largely unchanged, a result that is unsurprising given the comparison of prices to three years ago as opposed to only one year ago. |
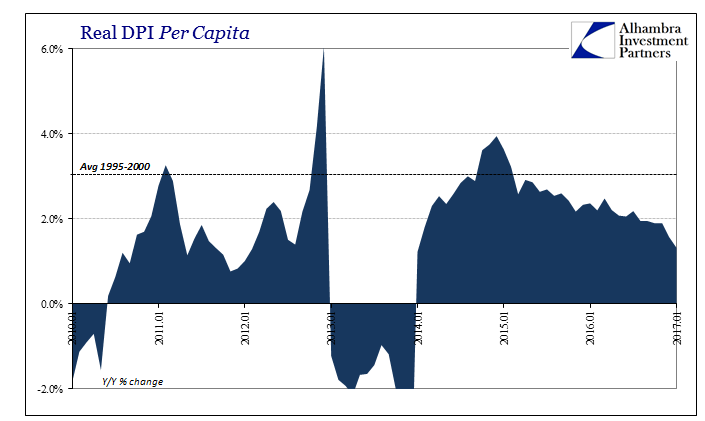
Real DPI Per Capita 2010 - 2017 |
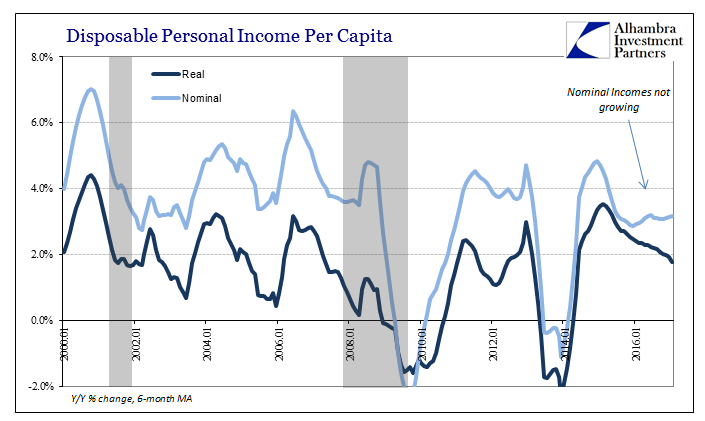
| Real Disposable Income Per Capita rose just 1.32% in January, the lowest gain since the start of 2014 (when tax changes in 2012 created the monstrous base effects you see above). That is about the same rate as August 2010, as well as August 2012, both periods of considerable economic strain and uncertainty. The difference then as opposed to now is nominal income growth that since the end of 2014 (coincidentally the time of the “best jobs market in decades” as well as the first approach and then completion of “full employment”) has been more subdued than has become usual for this lost decade. |
Disposable Personal Income Per Capita 2000-2016 |
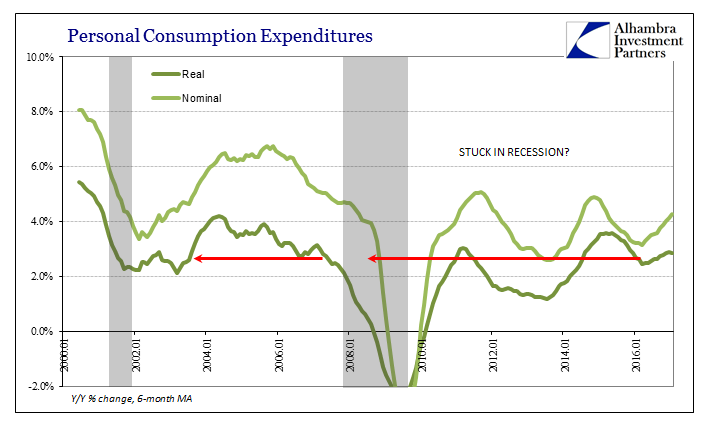
| Without nominal growth in income there is no meaningful rise in nominal spending estimates, suggesting that these price changes leave consumers to cut back in discretionary spending as to the proportion of non-discretionary items like gasoline that take up that much more of an unchanging budget (either work or fixed income). |
Personal Consumption Expenditures 2000-2016 |
It echoes in official statistics what we find in more detailed hard analysis. I wrote yesterday with regard to Target’s quarterly update:
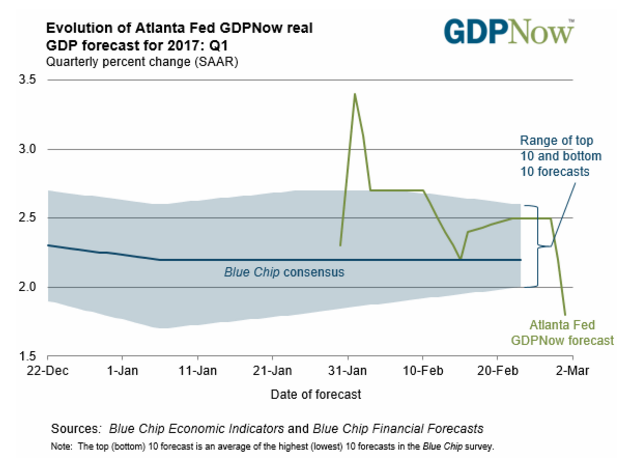
From this view, contrary to established policy, we had better hope that oil prices don’t rise and thus measured inflation decelerates all over again. The PCE spending estimates were drastically less than expected because of just this real vs. nominal imbalance. With the publication of the data series, the Atlanta Fed’s GDPNow estimate for Q1 2017 was reduced from 2.5% all the way to 1.8% – which does include still, for some reason, all the latest Q1 residual seasonality. |
Evolution of Atlanta Fed GDP |
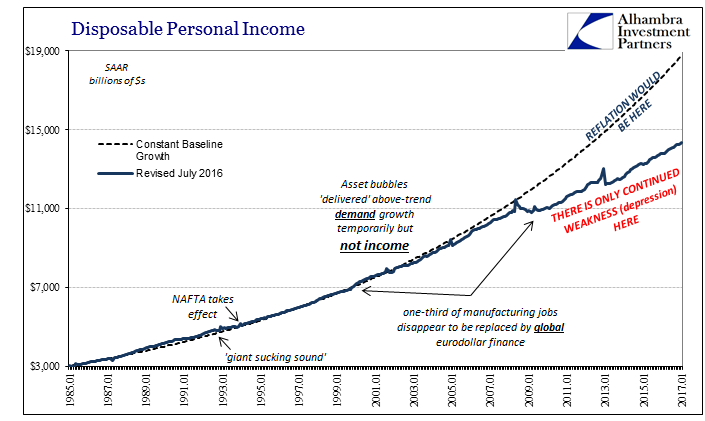
| In other words, all of this is consistent with an economy that remains stuck as it has been for years. The ebbs and flows are all minor in nature, and in many ways just a negative feedback loop repeating over and over on different time scales. This fourth “reflation” hope is based, as all of them, as if it might turn out any different than those prior. Instead, in the parlance of orthodox central banking, there are many serious “headwinds” still indicated one month already into 2017. |
Disposable Personal Income 1985-2017 |
Tags: Consumer Prices,consumer spending,CPI,currencies,department stores,depression,disposable personal income,earnings,economy,Featured,Federal Reserve/Monetary Policy,macro,Markets,newslettersent,nonstore retailers,oil prices,PCE,pce deflator,Personal Consumption Expenditures,price sensitivity,real disposable personal,real pce,Retail sales,Target,wages

