The payroll report for October 2017 was still affected by the summer storms in Texas and Florida. That was expected. The Establishment Survey estimates for August and September were revised higher, the latter from a -33k to +18k. Most economists were expecting a huge gain in October to snapback from that hurricane number, but the latest headline was just +261k. For those two months combined, the headline advanced at an average +140k rate, or below the 6-month average. US Establishment Survey Payrolls, Jan 2010 - Jul 2017 - Click to enlarge Total hours worked, which rebounded last year, seems to have stalled this year at a much lower growth rate. US Average Weekly Earnings, March 2006 - Sep 2017(see more posts on
Topics:
Jeffrey P. Snider considers the following as important: average weekly earnings, average weekly hours, consumer spending, currencies, economy, establishment survey, Featured, Federal Reserve/Monetary Policy, hours worked, household survey, incomes, inflation, jobs, labor force, Labor market, Markets, newsletter, payrolls, Retail sales, The United States, U.S. Average Earnings, U.S. Retail Sales, U.S. unemployment rate, wages
This could be interesting, too:
Nachrichten Ticker - www.finanzen.ch writes Die Performance der Kryptowährungen in KW 9: Das hat sich bei Bitcoin, Ether & Co. getan
Nachrichten Ticker - www.finanzen.ch writes Wer verbirgt sich hinter der Ethereum-Technologie?
Martin Hartmann writes Eine Analyse nach den Lehren von Milton Friedman
Marc Chandler writes March 2025 Monthly
| The payroll report for October 2017 was still affected by the summer storms in Texas and Florida. That was expected. The Establishment Survey estimates for August and September were revised higher, the latter from a -33k to +18k. Most economists were expecting a huge gain in October to snapback from that hurricane number, but the latest headline was just +261k. For those two months combined, the headline advanced at an average +140k rate, or below the 6-month average. |
US Establishment Survey Payrolls, Jan 2010 - Jul 2017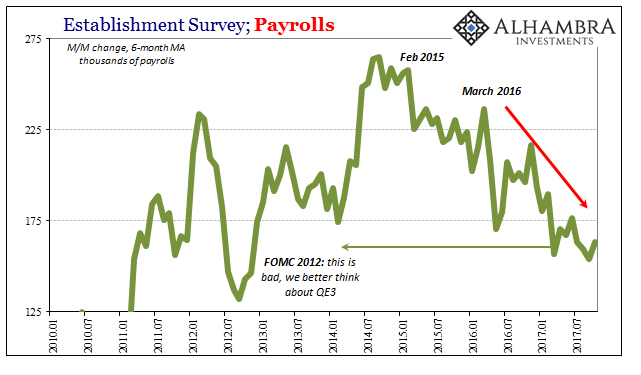 - Click to enlarge |
| Total hours worked, which rebounded last year, seems to have stalled this year at a much lower growth rate. |
US Average Weekly Earnings, March 2006 - Sep 2017(see more posts on U.S. Average Earnings, )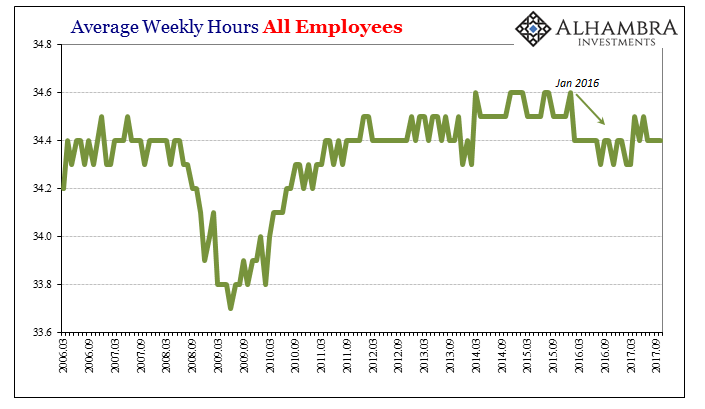 - Click to enlarge |
| That is consistent with the headline numbers where the labor market slowdown hasn’t really abated. |
US Average Weekly Earnings, Aug 2007 - 2017(see more posts on U.S. Average Earnings, )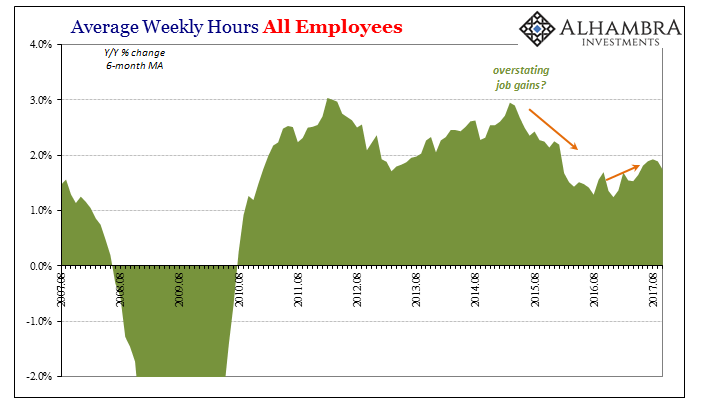 - Click to enlarge |
| Without much economic momentum overall the labor force has flattened off again. It shrank by 765k last month, greater than the 575k increase recorded the month prior. At 160.4 million, the labor force in October was up just 324k since February.
Slowing labor participation is the reason the unemployment rate keeps falling to ridiculously low levels. Even though total employment fell back by 484k for the Household Survey in October, the much larger decline in the labor force left the unemployment to drop to just 4.1%, the lowest since December 2000. |
US Unemployment Rate, Jan 2013 - Jul 2017(see more posts on U.S. Unemployment Rate, )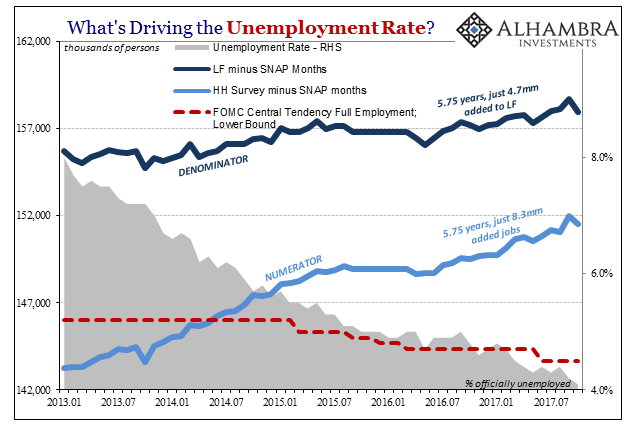 - Click to enlarge |
| At 4.1%, the unemployment rate has fallen far below the FOMC’s estimated central tendency for full employment. The range for the central tendency is the point at which the central bank expects slack to have been fully absorbed and therefore wages to rise sharply leading to accelerating consumer price increases. This is why Fed officials declare their expectation for wage-driven inflation at every possible moment.
With the actual unemployment rate now significantly underneath their lower bound, there is absolutely no reason for wage inflation to be anything but transitorily delayed – unless the unemployment rate is describing an economy that doesn’t really exist. Wage and earnings growth continues to be unusually depressed (NOTE: I use earnings because that’s what workers see and what employers really pay; if wage rates alone rise for non-economic reasons and there exists significant slack employers can modify the number of hours to offset wages which they can’t do if slack wasn’t present). |
US Average Weekly Earnings, Jan 2003 - 2017(see more posts on U.S. Average Earnings, )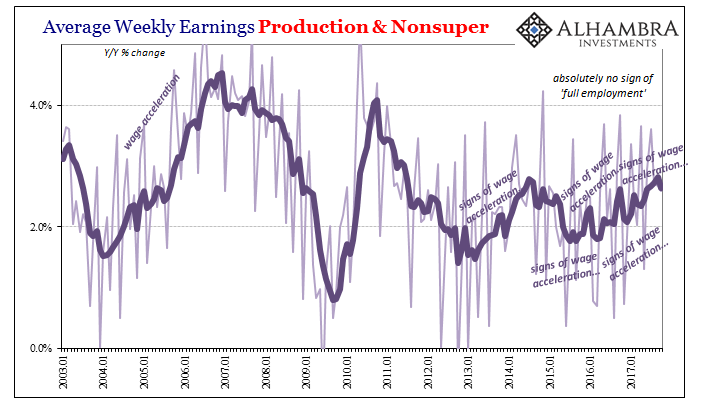 - Click to enlarge |
| Average weekly earnings continue to rise at around 2.5% to 2.7%, far less than they have in the past when the unemployment rate was around the same level. In fact, wages and earnings really should have started to accelerate in clear and convincing fashion several years ago. In the nineties and even during the soft recovery of mid-2000’s, earnings jumped such that an end to labor market slack was obvious at around 5.5% unemployment. |
US Full Employment Slack, Jan 1994 - 2017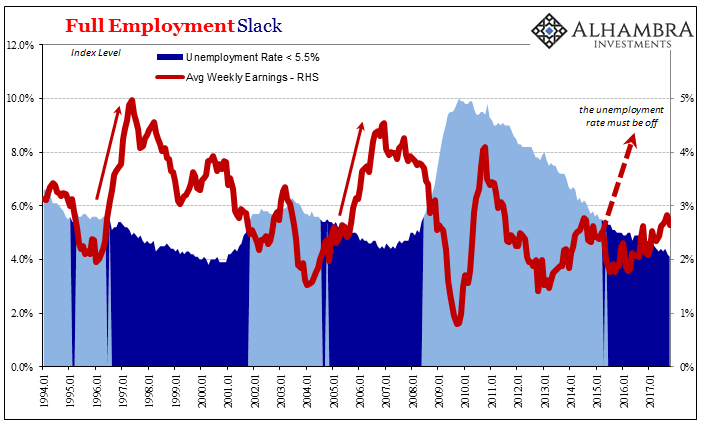 - Click to enlarge |
| Average weekly earnings were up just 2.6% for production and non-supervisory employees, and just 2.4% for all employees, with an average growth still in the mid 2% range. |
US Two Labor Stories, Jan 1995 - 2017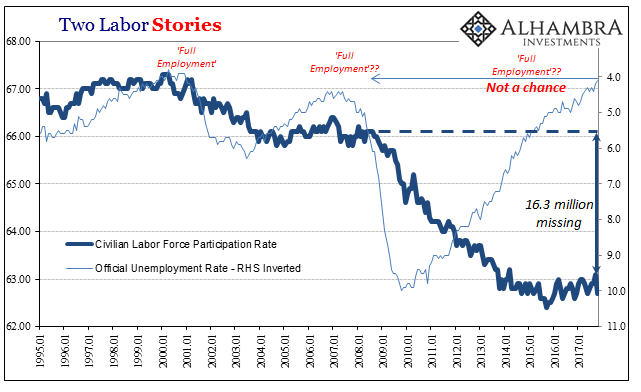 - Click to enlarge |
| With official unemployment of 4.1% now, and earnings still stuck less than 3%, there really can’t be any argument anymore about what has happened. |
Accounting for All Labor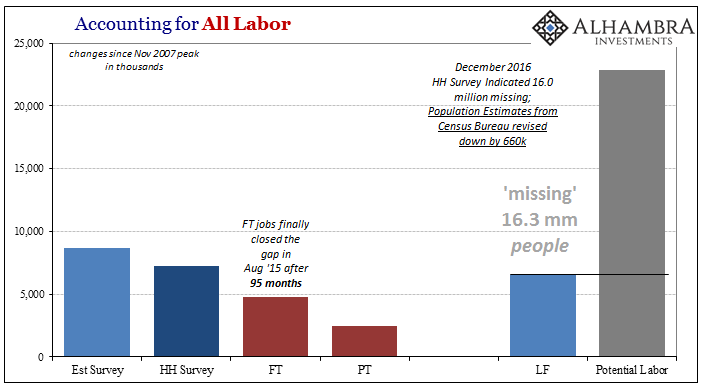 - Click to enlarge |
| Economists have tried their best to ignore those 15 or 16 million (or more) Americans who have fallen outside the official labor force tally. There are all sorts of explanations, really rationalizations, why it might have been appropriate to do so, but with the level of the unemployment rate and continued slack still being indicated in not just wages but national incomes and spending, too, there really is no option but to reject those benign interpretations. |
US Retail Sales, Jan 1992 - 2017(see more posts on U.S. Retail Sales, )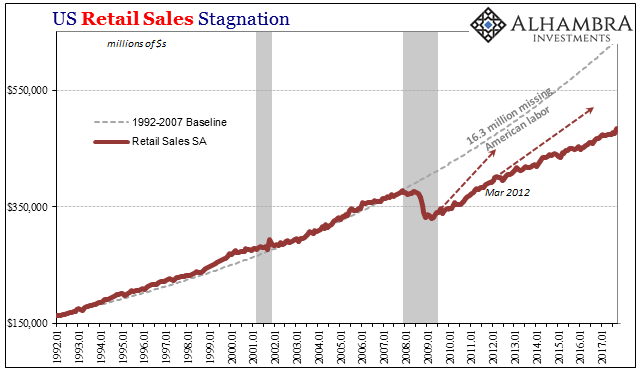 - Click to enlarge |
| There was a clear economic hole created by the Great “Recession” that has never been filled back in by recovery. The lackluster rebound in the labor force despite what was characterized as the “best jobs market in decades” shows instead that it never was close to that label. The numbers are skewed because the economy is skewed – the unemployment rate most of all since it wasn’t ever designed for a situation like this. |
US Labor Market Growth, 1968 - 2016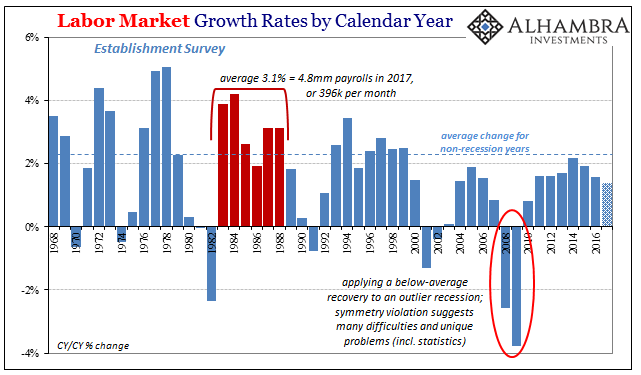 - Click to enlarge |
The labor market, in very simple terms, remains in a weak and fragile state. The rhetoric used in the mainstream to describe it, mostly now based on the unemployment rate alone, just isn’t appropriate. And it’s getting worse in 2017, not better. That’s the more immediate macro problem given that the economic mess created by the downturn associated with the “rising dollar” is so far in the past.
The worst part of that downturn began two years ago, and yet employers remain hesitant, and thus the labor force hesitant, through all that time. It suggests unusual, non-cyclical factors. It’s is not a good sign even if partially obscured by storm-related discrepancies. And it’s yet more strong evidence economists really don’t know what they are doing.
Tags: average weekly earnings,average weekly hours,consumer spending,currencies,economy,establishment survey,Featured,Federal Reserve/Monetary Policy,hours worked,household survey,incomes,inflation,jobs,labor force,Labor Market,Markets,newsletter,payrolls,Retail sales,U.S. Average Earnings,U.S. Retail Sales,U.S. Unemployment Rate,wages