The US reports the monthly jobs data tomorrow. The unemployment rate stood at 4.4% in June, after finishing last year at 4.7%. At the end of 2015 was 5.0%. Some economists expect the unemployment rate to have slipped to 4.3% in July. Recall that this measure (U-3) of unemployment counts those who do not have a job but are looking for one. There are several other measures, and which one is right depends on what question one is answering. A more comprehensive measure includes not only those looking for employment but also those that take part-time jobs because they cannot find full-time work (U-6). It includes people that are said to be “marginally attached” to the labor forces, which includes those that are not
Topics:
Marc Chandler considers the following as important: Featured, FX Trends, Great Graphic, jobs, newsletter, U.S. unemployment rate, USD
This could be interesting, too:
Nachrichten Ticker - www.finanzen.ch writes Die Performance der Kryptowährungen in KW 9: Das hat sich bei Bitcoin, Ether & Co. getan
Nachrichten Ticker - www.finanzen.ch writes Wer verbirgt sich hinter der Ethereum-Technologie?
Martin Hartmann writes Eine Analyse nach den Lehren von Milton Friedman
Marc Chandler writes March 2025 Monthly
The US reports the monthly jobs data tomorrow. The unemployment rate stood at 4.4% in June, after finishing last year at 4.7%. At the end of 2015 was 5.0%. Some economists expect the unemployment rate to have slipped to 4.3% in July.
Recall that this measure (U-3) of unemployment counts those who do not have a job but are looking for one. There are several other measures, and which one is right depends on what question one is answering.
A more comprehensive measure includes not only those looking for employment but also those that take part-time jobs because they cannot find full-time work (U-6). It includes people that are said to be “marginally attached” to the labor forces, which includes those that are not working or looking for work, but affirm that want to work and have looked a job in the past year. This measure of unemployment stood at 8.6% in June after finishing last year at 9.2% and 2015 just below 10%.
Discussions of what has happened to unemployment since the Great Financial Crisis tend to focus on the drop in the participation rate and age-related issues. The changing composition of the workforce, with Baby Boomers retiring and new hires, are unable to command comparable salaries, which in turn weighs on aggregate wage measures.
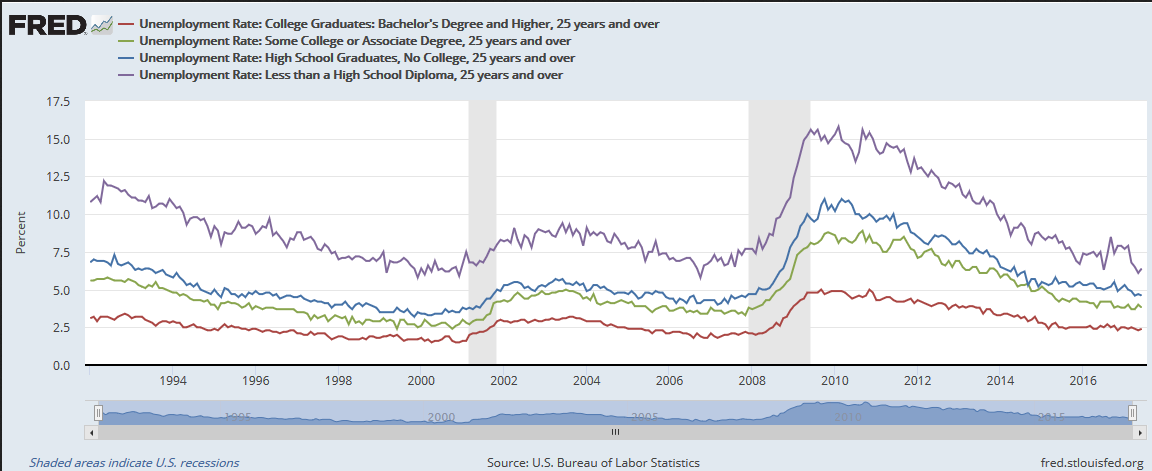
| Another way the labor force can be looked at is by education level. That is what the Great Graphic, from the St. Louis Fed shows. There are four educational cohorts tracked for people at least 25 years old. From top to bottom they are no high school degree (purple); high school graduate but no college (blue); some college or Associate Degree (green), college graduates with a Bachelor’s Degree or more (red).
The chart goes back a quarter of a century. The broad pattern remains the same. The more education, the lower the unemployment rate, not just now but consistently over the period under review. In June, those who graduated college had a 2.4% unemployment rate, or to say the same thing, looking at the glass as more full, 97.6% of those who graduated college are either working or looking for work. People who have some college, up to the Associate’s Degree had a 3.8% unemployment rate in June. People with a high school diploma had a 4.6% unemployment rate. The narrowness of the gap between high school graduates and some college is also noteworthy. Those without a high school degree have a 6.4% unemployment rate. |
U.S. Unemployment Rate 1994-2017(see more posts on U.S. Unemployment Rate, ) |
The Trump Administration is proposing a dramatic change in US immigration policies. It is not only illegal immigration that is incurring official wrath, but a 50% cut in legal immigration and a focus on skill-based criteria is advocated. In the context of this discussion, the share of immigrants who arrived with college degrees has nearly doubled to almost 50% from the 1986-1990 period. What this means is that in some states, immigrants have a higher level of educational attainment than the native population. According to the Economist, most states have gained college-educated immigrants between 2010 and 2015, and immigrants are more educated than Americans in just over half the states.
Tags: #USD,Featured,Great Graphic,jobs,newsletter,U.S. Unemployment Rate

