Summary:
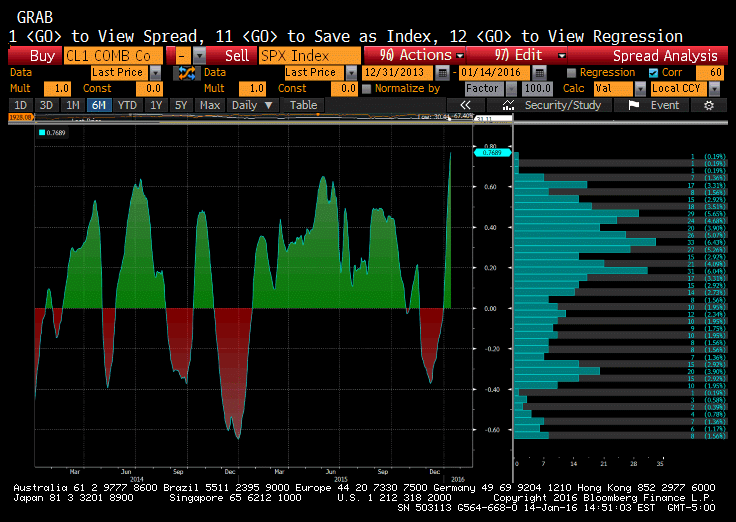
The US stock market and the oil market appear joined at the hip. The Great Graphic here, created on Bloomberg, shows the correlation of the two markets. It is near 0.77, which is the highest since September 2013. The correlation was conducted on the level of the S&P 500 and the level of the front-month light sweet crude oil futures contract. It tells us that the two markets have been moving in the same direction nearly eight of ten sessions over the past 60 sessions. As the chart shows (on the left is the correlation and on the right is the frequency distribution), the correlation is not stable, and presently it is at an extreme. Although it is a descriptive statistic, I read it as a warning that such a tight fit is not sustainable and will break down. Although the correlation holds, it is a salutary caution to short-term traders that while knowing the direction of oil has been a good tell of the direction of the S&P 500, one ought not bank on it for much longer. Investors are more interested in the correlation of returns rather than levels. Here the correlation (percent change) is about 0.33 over the last 60 sessions. This is the lower end of four-month range. The peak since 2013 was set this past November a little above 0.50. Over the past 30-days, the correlation of returns is near 0.25. Yesterday it was nearer 0.20, which is lowest since last June.
Topics:
Marc Chandler considers the following as important: Featured, FX Trends, newsletter
This could be interesting, too:
Nachrichten Ticker - www.finanzen.ch writes Die Performance der Kryptowährungen in KW 9: Das hat sich bei Bitcoin, Ether & Co. getan
Nachrichten Ticker - www.finanzen.ch writes Wer verbirgt sich hinter der Ethereum-Technologie?
Martin Hartmann writes Eine Analyse nach den Lehren von Milton Friedman
Marc Chandler writes March 2025 Monthly

The US stock market and the oil market appear joined at the hip. The Great Graphic here, created on Bloomberg, shows the correlation of the two markets. It is near 0.77, which is the highest since September 2013.
The correlation was conducted on the level of the S&P 500 and the level of the front-month light sweet crude oil futures contract. It tells us that the two markets have been moving in the same direction nearly eight of ten sessions over the past 60 sessions.
As the chart shows (on the left is the correlation and on the right is the frequency distribution), the correlation is not stable, and presently it is at an extreme. Although it is a descriptive statistic, I read it as a warning that such a tight fit is not sustainable and will break down. Although the correlation holds, it is a salutary caution to short-term traders that while knowing the direction of oil has been a good tell of the direction of the S&P 500, one ought not bank on it for much longer.
Investors are more interested in the correlation of returns rather than levels. Here the correlation (percent change) is about 0.33 over the last 60 sessions. This is the lower end of four-month range. The peak since 2013 was set this past November a little above 0.50.
Over the past 30-days, the correlation of returns is near 0.25. Yesterday it was nearer 0.20, which is lowest since last June.
