Is discount pressure on new car sales a signal of weaker demand?Amid all the good macro signals from the US economy lately (see our Flash Note about May payrolls, for instance), new car sales present a mixed picture. Car sales have virtually plateaued in the US, averaging 17.06 million so far this year (January-May), up only +0.3% from the same period last year.One way to assess prospects for new car sales ahead is to look at the price index. From it, one can gauge the extent of discounting and thereby deduce the strength of underlying demand.The Bureau of Labor Statistics released its May CPI report on 12 June. It showed that the price sub-index for new cars was down 1.1% y-o-y. Prices for new cars are down 1.4% so far this year on average. This disinflation has contributed to keeping US
Topics:
Thomas Costerg considers the following as important: car discounts, Macroview, US car sales, US consumer demand
This could be interesting, too:
Cesar Perez Ruiz writes Weekly View – Big Splits
Cesar Perez Ruiz writes Weekly View – Central Bank Halloween
Cesar Perez Ruiz writes Weekly View – Widening bottlenecks
Cesar Perez Ruiz writes Weekly View – Debt ceiling deadline postponed
Is discount pressure on new car sales a signal of weaker demand?
Amid all the good macro signals from the US economy lately (see our Flash Note about May payrolls, for instance), new car sales present a mixed picture. Car sales have virtually plateaued in the US, averaging 17.06 million so far this year (January-May), up only +0.3% from the same period last year.
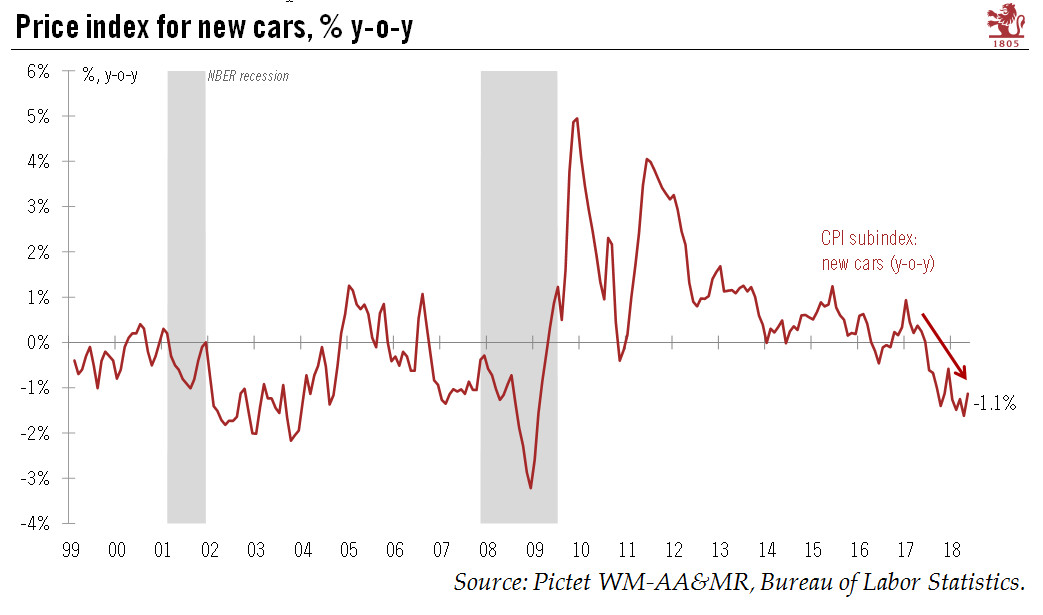
One way to assess prospects for new car sales ahead is to look at the price index. From it, one can gauge the extent of discounting and thereby deduce the strength of underlying demand.
The Bureau of Labor Statistics released its May CPI report on 12 June. It showed that the price sub-index for new cars was down 1.1% y-o-y. Prices for new cars are down 1.4% so far this year on average. This disinflation has contributed to keeping US core CPI inflation in check lately.
The ongoing discounting of new car prices is not good news, as it possibly reveals some fragility in underlying demand. Not helping is the run up in oil prices (and therefore in retail gasoline prices), which has already led to decelerating growth in car usage in the US (vehicle miles travelled).
All’s not bad news however; there could be a ‘quality adjustment’ at play that helps to explain this disinflation. By quality adjustment is meant the downward adjustment that statisticians make to car prices to take account of technological advances to new models.
The outlook for US car sales appears quite subdued for the rest of the year—and could get worse if President Trump slaps tariffs on car imports.