While we still believe an increase in capex will contribute significantly to US growth this year, hard data remains uneven.Our 2018 US growth scenario of 3.0% GDP growth in the US is premised on solid non-residential investment growth of 7.0% – itself based on: (1) the positive business environement post tax cuts; (2) strong global growth; and (3) tighter domestic resource and capacity utilisation.In Q1, US investment was up 6.1% y-o-y, down from 6.3% in full-year 2017. So we need US capital expenditure (investment) to accelerate again in the coming quarters to get to our 7% annual forecast, which is a crucial ingredient for our 3% GDP growth forecast.The recent signals about investment show a disconcerting gap between surveys (i.e. what businesses say) and hard data (i.e. what they do).
Topics:
Thomas Costerg considers the following as important: Investment intentions, Macroview, US capex, US Chart of the week, US corporate spending
This could be interesting, too:
Cesar Perez Ruiz writes Weekly View – Big Splits
Cesar Perez Ruiz writes Weekly View – Central Bank Halloween
Cesar Perez Ruiz writes Weekly View – Widening bottlenecks
Cesar Perez Ruiz writes Weekly View – Debt ceiling deadline postponed
While we still believe an increase in capex will contribute significantly to US growth this year, hard data remains uneven.
Our 2018 US growth scenario of 3.0% GDP growth in the US is premised on solid non-residential investment growth of 7.0% – itself based on: (1) the positive business environement post tax cuts; (2) strong global growth; and (3) tighter domestic resource and capacity utilisation.
In Q1, US investment was up 6.1% y-o-y, down from 6.3% in full-year 2017. So we need US capital expenditure (investment) to accelerate again in the coming quarters to get to our 7% annual forecast, which is a crucial ingredient for our 3% GDP growth forecast.
The recent signals about investment show a disconcerting gap between surveys (i.e. what businesses say) and hard data (i.e. what they do). The surveys are indeed strong. The New York Federal Reserve’s recently released ‘Empire’ survey for May showed solid capex intentions (29.5, well above the 5-year average of 17.6). A special semi-annual ISM survey this month showed that capex intentions in the manufacturing sector up 10.1% on average for this year, compared with 2.7% in December 2017.
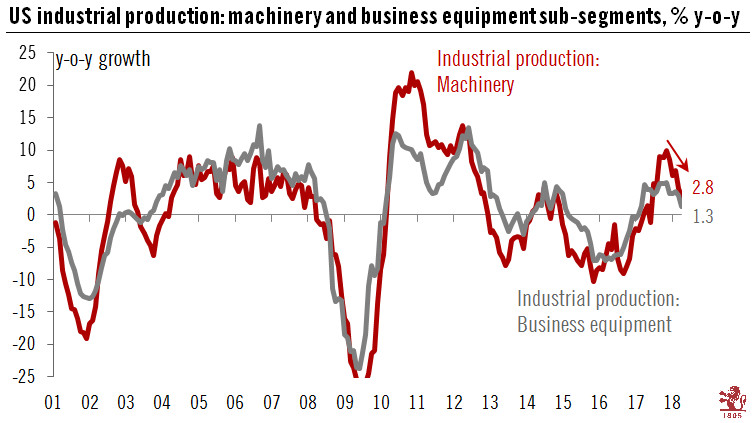
However, hard data paint a more mixed picture. A good proxy for capex can be found in the industrial production series, particularly the machinery and business equipment sub-indices, which grew at a y-o-y rate of just 2.8% and 1.3%, respectively, in April—a disappointing outcome when set beside the buoyant surveys. For now, we are keeping our US capex optimism intact, but it could be called into question if hard data continues to underwhelm.