Sunday , April 28 2024
Home / Tag Archives: US Chart of the week

Tag Archives: US Chart of the week

China dominates many US supply chains

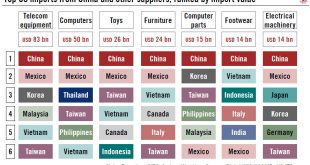
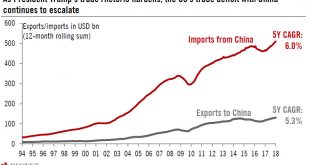
The US consumer may end up being subject to a de facto ‘tax’ as the scope for finding alternative suppliers is limited.Last week, the Trump administration said it would add USD200 billion of Chinese imports to its tariff net, possibly taking effect as soon as September. These tariffs come on top of the tariffs on USD50 billion of Chinese goods already announced (of which USD34 billion already kicked in early July). By way of comparison, the US imported USD506 billion worth of merchandise...

Read More »

US chart of the week—Capex conundrum

While we still believe an increase in capex will contribute significantly to US growth this year, hard data remains uneven.Our 2018 US growth scenario of 3.0% GDP growth in the US is premised on solid non-residential investment growth of 7.0% – itself based on: (1) the positive business environement post tax cuts; (2) strong global growth; and (3) tighter domestic resource and capacity utilisation.In Q1, US investment was up 6.1% y-o-y, down from 6.3% in full-year 2017. So we need US capital...

Read More »

US chart of the week – Benefits vs wages

Subdued wage growth disguises rising cost of total compensation.The next US monthly employment report (published this Friday) will once again be scrutinised for signs that wage growth is on the rise. While wage growth has been improving in recent years, the pace has remained glacial. Average hourly earnings were up 2.6% y-o-y in February, a relatively subdued pace when taking into account near full employment (the unemployment rate was 4.1% in February).There are many factors explaining the...

Read More »

US chart of the week – Corporate euphoria

CEO sentiment reaches a record high, but protectionist tendencies could impact confidence down the road.US businesses are feeling good – in fact, they are borderline euphoric. The latest evidence comes from the quarterly Business Roundtable CEO economic outlook index, a survey of 137 CEOs, conducted in February, which rose to its highest level since the survey began 15 years ago. All three sub-indices (capex, employment, sales) rose to fresh highs.Particularly encouraging was the sharp rise...

Read More »

US chart of the week – Deficit with China

The escalating trade deficit with China comes at a politically sensitive time.The release of January trade data could not have been more topical, coming as it does shortly after the Trump Administration announced fresh tariffs on imports of steel and aluminum, in the context of dangerously hardening trade rhetoric.The monthly US trade defict rose to USD 56.6bn in January, the highest since October 2008. And the politically-sensitive deficit with China rose to USD 36.0bn (non-seasonally...

Read More »

Low loan demand: a bad omen for investment

Tax reform could help sluggish demand for corporate loans, but unlikely to be a game changer when it comes to business investment.A key question for the 2018 US outlook, and beyond, is whether US firms will finally open their purses and invest more after years of frugality. Investment is key to sustaining the current expansion. Recent buoyant business surveys like the ISM manufacturing index seem to point that way. However, a chasm has opened between what firms are saying and what they do....

Read More »