Growth in US capex may be skewed toward the booming energy sector, while manufacturing still has spare capacity.A key question for this year’s US macroeconomic outlook is whether firms become less stingy about investment (capex). The December 2017 tax cuts have fuelled hopes for a long-awaited acceleration in US capex, as they de facto lower the cost of capital. The tax boost to collective business sentiment, the so-called ‘animal spirits’, is supposed to be an additional impetus to capex spending.Most US business surveys have shown that capex intentions have indeed risen sharply this year. Our own annual US GDP growth forecast of 3% is premised on elevated real investment growth of 7% in the US (it rose 6.1% y-o-y in Q1-2018).But there are more concrete reasons why businesses invest. The
Topics:
Thomas Costerg considers the following as important: Macroview
This could be interesting, too:
Cesar Perez Ruiz writes Weekly View – Big Splits
Cesar Perez Ruiz writes Weekly View – Central Bank Halloween
Cesar Perez Ruiz writes Weekly View – Widening bottlenecks
Cesar Perez Ruiz writes Weekly View – Debt ceiling deadline postponed
Growth in US capex may be skewed toward the booming energy sector, while manufacturing still has spare capacity.
A key question for this year’s US macroeconomic outlook is whether firms become less stingy about investment (capex). The December 2017 tax cuts have fuelled hopes for a long-awaited acceleration in US capex, as they de facto lower the cost of capital. The tax boost to collective business sentiment, the so-called ‘animal spirits’, is supposed to be an additional impetus to capex spending.
Most US business surveys have shown that capex intentions have indeed risen sharply this year. Our own annual US GDP growth forecast of 3% is premised on elevated real investment growth of 7% in the US (it rose 6.1% y-o-y in Q1-2018).
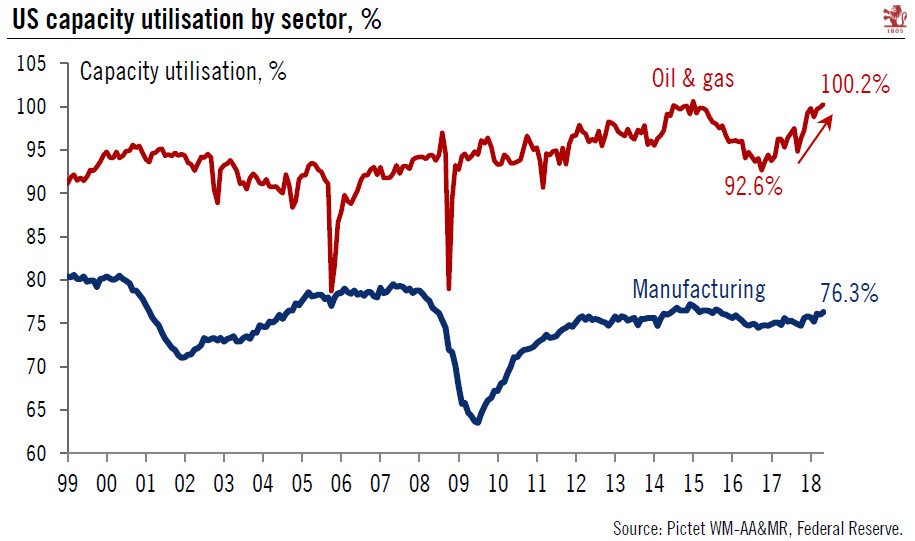
But there are more concrete reasons why businesses invest. The plainest is stretched capacity utilisation. So how is US capacity utilisation looking? Total industrial capacity utilisation rose to 78.0% in April, heading towards the November 2014 high of 79.6%. A lot of that increase is in the booming oil & gas sector, where capacity utilisation is 100.2%.
By contrast, capacity utilisation in the manufacturing sector stood at 76.3% in April, a rather tame level by historical standards (in 2005-07, it averaged 78.5%). The risk therefore exists that this year’s investment growth is skewed towards the energy sector – where there is genuine overheating – and that it is not as broad based as we expect.