Both the ISM Manufacturing index and its Non-Manufacturing counterpart rose m-o-m in March. However, other economic data recently published were rather weak. Our forecast that GDP will grow by 2.0% in Q1 is revised down to 1.5%. However, our forecast for yearly average growth in 2016 remains unchanged at 2.0%. The ISM Manufacturing survey for March 2016 was published on Friday last week. The headline reading bounced back further from 49.5 in February to an eight-month high of 51.8 in March, above consensus expectations (51.0). Although the ISM index has recovered markedly so far this year, it was particularly weak at the end of last year. As things stand, the ISM headline index is actually ‘only’ back up to around where the Markit Manufacturing PMI (reflecting results from the other main survey on manufacturing activity) was hovering over the past few months (51.5 in March). The details of the Manufacturing ISM report showed that the Employment sub-index actually eased back from 48.5 in February to 48.1 in March. However, the Production sub-index increased further from 52.8 in February to 55.3 in March, and the New Orders sub-index – the most forward-looking component of the survey – jumped from 51.5 in February to 58.3 in March, its highest reading since November 2014.
Topics:
Bernard Lambert considers the following as important: GDP, ISM, Macroview, United States
This could be interesting, too:
Dirk Niepelt writes “Governments are bigger than ever. They are also more useless”
Lance Roberts writes Technological Advances Make Things Better – Or Does It?
Dirk Niepelt writes Urban Roadway in America: Land Value
Lance Roberts writes Risks Facing Bullish Investors As September Begins
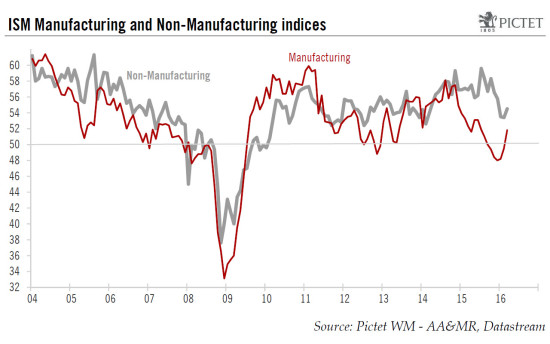
Both the ISM Manufacturing index and its Non-Manufacturing counterpart rose m-o-m in March. However, other economic data recently published were rather weak. Our forecast that GDP will grow by 2.0% in Q1 is revised down to 1.5%. However, our forecast for yearly average growth in 2016 remains unchanged at 2.0%.
The ISM Manufacturing survey for March 2016 was published on Friday last week. The headline reading bounced back further from 49.5 in February to an eight-month high of 51.8 in March, above consensus expectations (51.0). Although the ISM index has recovered markedly so far this year, it was particularly weak at the end of last year. As things stand, the ISM headline index is actually ‘only’ back up to around where the Markit Manufacturing PMI (reflecting results from the other main survey on manufacturing activity) was hovering over the past few months (51.5 in March).
The details of the Manufacturing ISM report showed that the Employment sub-index actually eased back from 48.5 in February to 48.1 in March. However, the Production sub-index increased further from 52.8 in February to 55.3 in March, and the New Orders sub-index – the most forward-looking component of the survey – jumped from 51.5 in February to 58.3 in March, its highest reading since November 2014.
Also encouraging was that the sub-index measuring a firm’s assessment of the level of its customer’s inventories remained below the 50-point threshold for the second month in a row (49.0 in March), suggesting the ongoing inventory adjustment may be approaching its end.
The sharp rebound in the ISM Manufacturing index over the past three months is a bit surprising. The recent marked decline in the dollar’s trade-weighted value and the rebound in oil prices may well bring some support to manufacturing activity. However, this kind of effect usually takes a few months to develop. The recovery in the ISM index appears to have come quite rapidly, and also looks surprisingly pronounced. We have some doubts that this manufacturing revival will prove really powerful. In any case, the manufacturing sector accounts for only some 12% of the overall US economy.
ISM Non-Manufacturing index bounced back a little
The ISM Non-Manufacturing survey was published today. The headline index bounced back from 53.4 in February to 54.5 in March, slightly above consensus expectations (54.2). However, a sizeable fall was recorded over the previous four months (see previous chart). Most sub-indices bounced back last month. The sub-index for the Business Activity rose by 2.0 points m-o-m to 59.8 in March, whilst the New Orders sub-index increased by 1.2 points to 56.7.
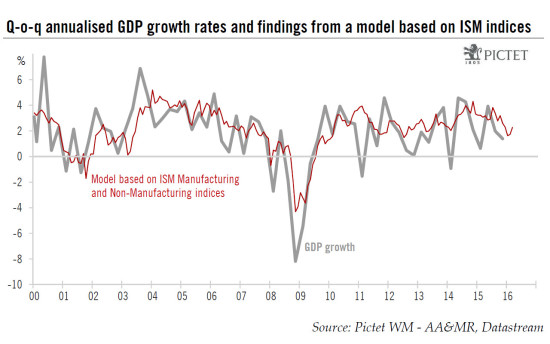
Taken together, the two ISM indices suggest that overall economic growth bounced back a little at the end of last quarter. If we use historical correspondence to try to calibrate what the ISM indices point to in terms of GDP growth (see chart above), we arrive at 2.3% in March and 1.9% on average in Q1, not such low readings in themselves, but much lower than was registered on average in Q4 (2.7%) and Q3 (3.3%). Nevertheless, although ISM surveys are timely and useful indicators of the strength of the economy, they are not very reliable at forecasting GDP growth in the short run. Indeed, ISM indices had been pointing to 2.7% GDP growth in Q4 whereas the third estimate published last week for this was 1.4%.
Other recent data were rather soft
Overall, March’s ISM surveys were mildly encouraging, with some improvement in both the Manufacturing index and its Non-Manufacturing counterpart. The other economic statistics published recently were generally soft. Admittedly, job creation remained robust in March (215,000) and on average in Q1 (209,000), whilst the further rebound in the participation rate appears encouraging, as it suggests more people are entering or re-entering the labour market. However, February’s core capital goods orders and shipments were soft, and today’s trade report for February confirmed that net exports remain an important drag on economic growth.
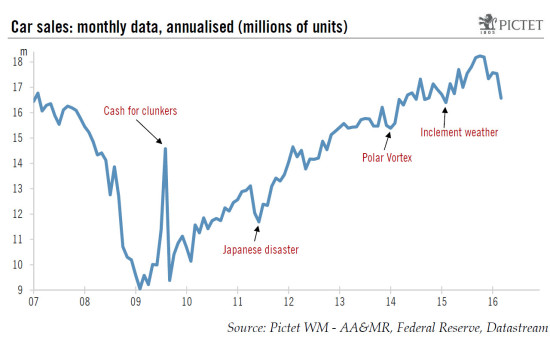
Even more importantly, data on consumption were surprisingly soft recently. Following a sharp downward revision for January’s number and only a modest monthly increase in February, it now appears that between Q4 and January-February real consumer spending has grown by ‘only’ a moderate 1.5% annualised, significantly softer than q-o-q growth in Q4 (2.4%, revised up from 2.0%). Moreover, data for auto sales in March – published last Friday – were surprisingly weak (see chart below). Car sales reached a record high in October last year, and some payback was to be expected. However, the extent of the decline recorded over the past few months is surprising. Auto sales have fallen back by 14.6% q-o-q annualised in Q1 2016.
We don’t want to overreact to these soft numbers. Consumption statistics have been volatile over the past few years, with often substantial revisions. Moreover, between Q4 and January-February, real disposable income increased by 3.4% annualised, against 1.5% for consumption. This means that the savings rate has increased markedly over the past few months, an unexpected development. With such robust growth in real household income, consumption growth may well be revised up, or at least pick up somewhat in the near future.
Nevertheless, following this set of disappointing data, our forecasts that consumption will show a growth rate of 3.0% q-o-q annualised in Q1 and GDP a rate of 2.0% both look too high for now. We are revising them to 2.2%, respectively 1.5%. However, as Q4 GDP growth was revised up from 1.0% to 1.4% on 25 March, our forecast for yearly average GDP growth in 2016 remains unchanged at 2.0%.


