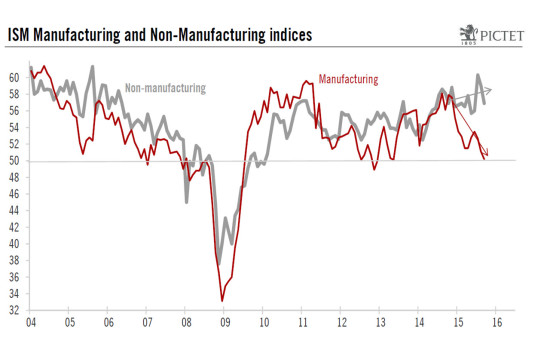
The ISM indices are diverging quite noticeably. The Manufacturing index fell to almost 50% in September, whereas its Non-Manufacturing counterpart – though steeply down m-o-m in September – remained pitched at much higher levels. Taken together, they point towards economic growth running above 3.5% in Q3. We continue to expect healthy growth in H2 2015 and 2016. The US economy is currently being confronted simultaneously with strong negative forces (much firmer dollar; weak foreign demand; stress on financial markets; negative impact of sharply lower oil prices on investment and output in the domestic oil sector) and powerful positive forces (robust growth in employment and incomes; supportive credit dynamics; ongoing revival in the housing market; rising public spending; favourable impact of sharply lower oil prices on consumption). The consequence of these diverging forces is that trajectories for consumption, domestic demand and activity in construction and services, which are growing robustly, are diametrically opposed to those for trade, the oil sector and manufacturing activity, which are acting as substantial drags on overall GDP growth. And the ISM indices provide a good illustration of this state of affairs. ISM Manufacturing index at its lowest ebb since 2013 The ISM Manufacturing survey for September 2015 was published on Thursday last week.
Topics:
Bernard Lambert considers the following as important: Macroview
This could be interesting, too:
Cesar Perez Ruiz writes Weekly View – Big Splits
Cesar Perez Ruiz writes Weekly View – Central Bank Halloween
Cesar Perez Ruiz writes Weekly View – Widening bottlenecks
Cesar Perez Ruiz writes Weekly View – Debt ceiling deadline postponed
The ISM indices are diverging quite noticeably. The Manufacturing index fell to almost 50% in September, whereas its Non-Manufacturing counterpart – though steeply down m-o-m in September – remained pitched at much higher levels.
Taken together, they point towards economic growth running above 3.5% in Q3. We continue to expect healthy growth in H2 2015 and 2016.
The US economy is currently being confronted simultaneously with strong negative forces (much firmer dollar; weak foreign demand; stress on financial markets; negative impact of sharply lower oil prices on investment and output in the domestic oil sector) and powerful positive forces (robust growth in employment and incomes; supportive credit dynamics; ongoing revival in the housing market; rising public spending; favourable impact of sharply lower oil prices on consumption). The consequence of these diverging forces is that trajectories for consumption, domestic demand and activity in construction and services, which are growing robustly, are diametrically opposed to those for trade, the oil sector and manufacturing activity, which are acting as substantial drags on overall GDP growth. And the ISM indices provide a good illustration of this state of affairs.
ISM Manufacturing index at its lowest ebb since 2013
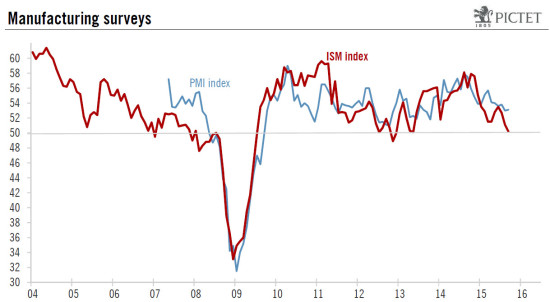
The ISM Manufacturing survey for September 2015 was published on Thursday last week. The headline reading dipped further from 51.1 in August to 50.2 in September, falling short of consensus expectations (50.6).
This yardstick is back to its lowest level since May 2013. As things stand, the Markit Manufacturing PMI (reflecting results from the other main survey on manufacturing activity) remains above its ISM counterpart. It actually inched back up marginally: 53.1 in September, after 53.0 in August (see chart below).
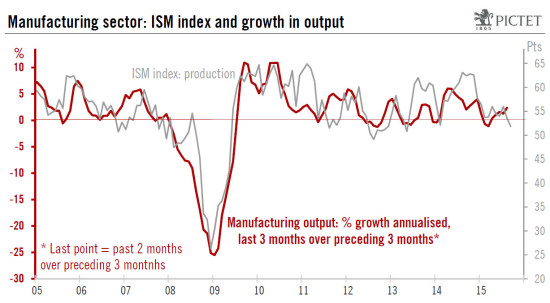
The details of the ISM report do not offer many more grounds for encouragement. The three most important sub-indices – Employment, Production and New Orders – declined further noticeably m-o-m. The fall in the New Orders sub-index was particularly striking: it plunged from 56.5 in July to 51.7 in August and 50.1 in September. This index is supposed to be the most forward-looking component of the survey.
In any event, as we mentioned above, the combined effect of lower oil prices, soft foreign demand and a higher dollar is a clear sharp negative factor for the manufacturing sector which is much more dependent on exports and the oil-extraction sector than the whole services-oriented economy. Moreover, a downward correction in inventories has probably amplified the downturn in manufacturing activity over the past few months. Fortunately, the manufacturing sector represents only some 12% of the overall US economy.
ISM Non-Manufacturing index remained at a high level in Q3
The ISM Non-Manufacturing survey was published today. Unlike its Manufacturing counterpart, the composite Non-Manufacturing index remained at elevated levels. Admittedly, it did drop back sharply from 60.3 in July to 59.0 in August and 56.9 in September, but the levels posted in July and August were the two highest monthly readings for a decade. Consensus estimates had been looking for a higher level of 57.5 for September.
Barring the indicator for employment, most sub-indices fell back further m-o-m in September, but remain at historically high levels. This was notably the case for the New Orders sub-index which dropped by a sizeable 6.7 points m-o-m to 56.7. Meanwhile, quite surprisingly in light of last week’s soft employment report, the ISM Employment sub-index bounced back from 56.0 in August to 58.3 in September.
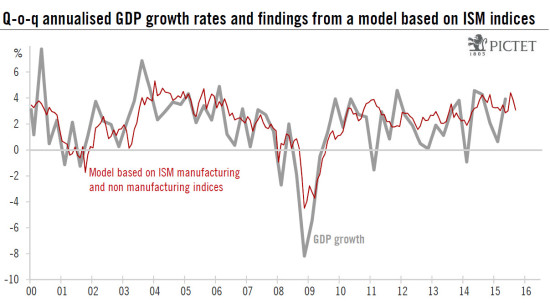
Nevertheless, taken together, the two ISM composite indices suggest that overall economic growth has remained quite robust in Q3. If we use historical correspondence to seek to calibrate what the ISM indices are pointing towards in terms of GDP growth (see chart below), we arrive at 3.1% in September and 3.8% on average in Q3, following averages of 3.1% in Q2 and 3.2% in Q1. The ISM surveys, therefore, suggest the economy has expanded robustly in Q3. Nevertheless, although ISM surveys are timely and useful indicators of the strength in the economy, they are not very reliable at forecasting GDP growth in the short run. Indeed, as we have seen above, ISM indices had been pointing to 3.2% GDP growth in Q1 2015 whereas the last estimate for this was 0.6%.
The high levels recorded by the Non-Manufacturing index in Q3 are quite encouraging for the economy. However, the declines recorded by both ISM indices between July and September mean that prospects for Q4 are looking more uncertain, at least judging by this set of indicators.
Overall, although we trimmed our forecasts slightly at the end of last week, we continue to expect healthy GDP growth in H2 and 2016. We are forecasting q-o-q annualised GDP growth to average 2.4% in H2 (2.2% in Q3 and 2.6% in Q4) and yearly average growth to settle at 2.5% in 2015 and 2.4% in 2016.


