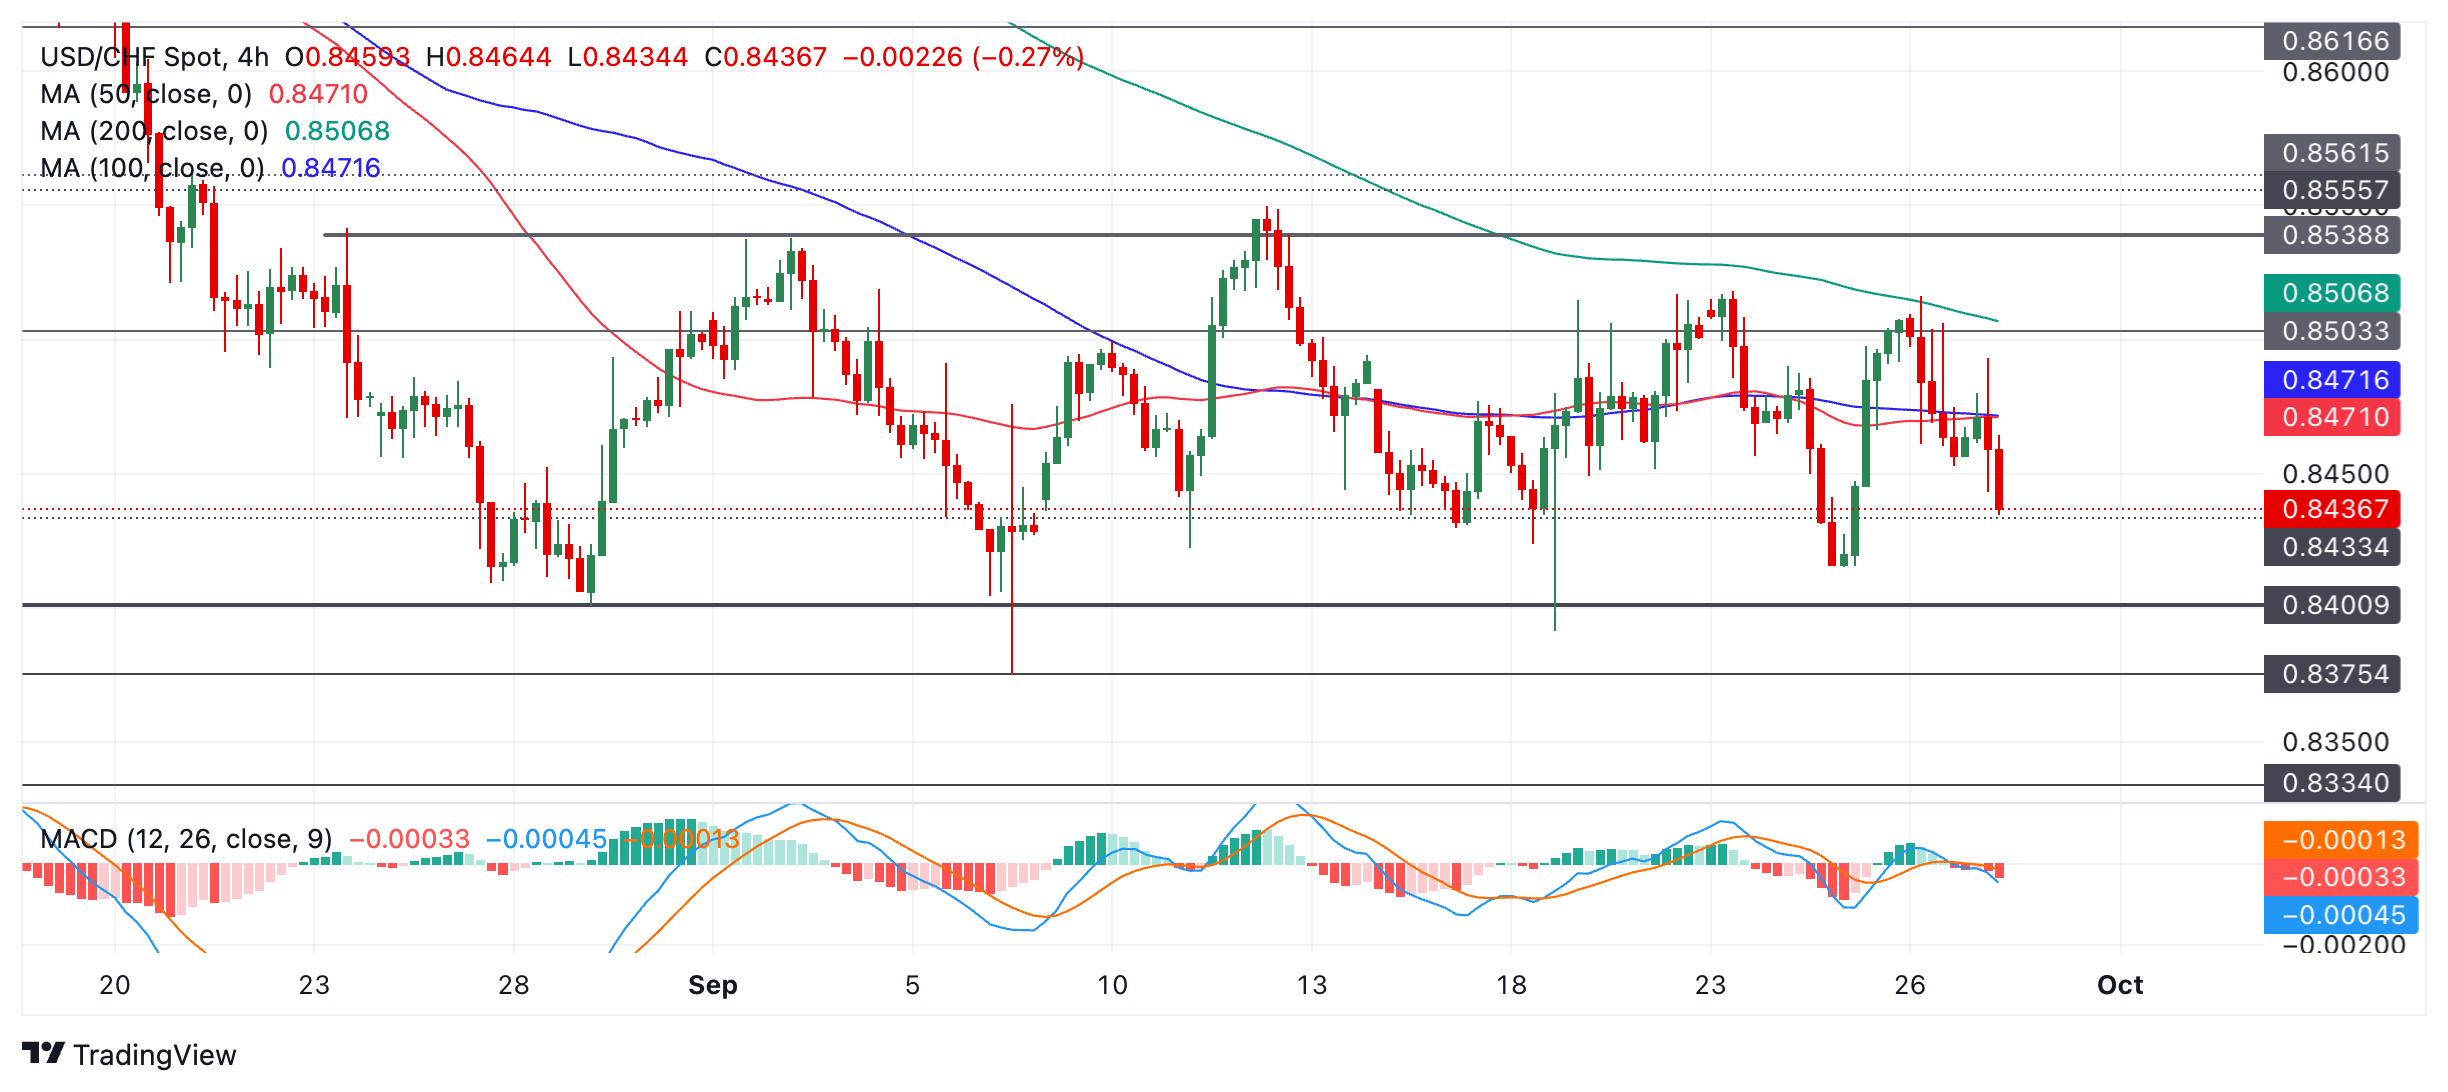
USD/CHF is trading lower within a range formed since August. It is in a sideways trend and a decisive breakout would be required to give directionality. USD/CHF continues trading up and down within a range. It is probably in a sideways trend, which given the principle that “the trend is your friend” is likely to endure. USD/CHF 4-hour Chart USD/CHF is currently moving down within the range and it will probably reach at least as far as the 0.8415, the September 25 lows. A particularly bearish move might even fall to the 0.8400 floor. After that it will probably recover and continue the sideways trend. The Moving Average Convergence Divergence (MACD) momentum indicator is below the signal and the zero lines indicating bearishness. A
Topics:
Joaquin Monfort considers the following as important: 1.) FXStreet on SNB&CHF, 1) SNB and CHF, Featured, newsletter
This could be interesting, too:
Nachrichten Ticker - www.finanzen.ch writes Die Performance der Kryptowährungen in KW 9: Das hat sich bei Bitcoin, Ether & Co. getan
Nachrichten Ticker - www.finanzen.ch writes Wer verbirgt sich hinter der Ethereum-Technologie?
Martin Hartmann writes Eine Analyse nach den Lehren von Milton Friedman
Marc Chandler writes March 2025 Monthly
- USD/CHF is trading lower within a range formed since August.
- It is in a sideways trend and a decisive breakout would be required to give directionality.
USD/CHF continues trading up and down within a range. It is probably in a sideways trend, which given the principle that “the trend is your friend” is likely to endure.
USD/CHF 4-hour Chart
USD/CHF is currently moving down within the range and it will probably reach at least as far as the 0.8415, the September 25 lows. A particularly bearish move might even fall to the 0.8400 floor. After that it will probably recover and continue the sideways trend.
The Moving Average Convergence Divergence (MACD) momentum indicator is below the signal and the zero lines indicating bearishness.
A decisive break out of the range – either higher or lower – would change the range-bound consolidation mode. The top of the range lies at 0.8550 (September 12 high); the bottom at 0.8375 (September 6 low). A decisive break would be one accompanied by a longer-than-average candlestick that closed near its high in the case of a bullish break and low in a bearish case. That, or three consecutive bullish or bearish candles that broke either above or below the levels.
Given the trend prior to the range was bearish the odds margin ally favor a downside breakout. Such a move would be expected to go as low as 0.8318, the 61.8% Fibonacci extrapolation of the height of the range extrapolated lower.
Tags: Featured,newsletter

