With the Fed (sadly) taking center stage last week, and market rejections of its rate hikes at the forefront, lost in the drama was January 2022 TIC. Understandable, given all its misunderstood numbers are two months behind at their release. There were some interesting developments regardless, and a couple of longer run parts that deserve some attention. Picking up where TIC left off from December, when more indicated bad (tight money) than good (not as tight), January kind of reversed the balance. Maybe. The TIC figures are some of the noisiest high frequency data you’ll ever see, so any interpretations are immediately highly salted. We had pointed out, for example, that US banks reported fewer of their own liabilities to foreigners in December; it had actually
Topics:
Jeffrey P. Snider considers the following as important: $CNY, 5.) Alhambra Investments, Belgium, bonds, caribbean, Cayman Islands, China, currencies, economy, eurodollar system, Europe, Featured, Federal Reserve/Monetary Policy, global dollar shortage, Japan, Markets, newsletter, tic
This could be interesting, too:
Nachrichten Ticker - www.finanzen.ch writes Die Performance der Kryptowährungen in KW 9: Das hat sich bei Bitcoin, Ether & Co. getan
Nachrichten Ticker - www.finanzen.ch writes Wer verbirgt sich hinter der Ethereum-Technologie?
Martin Hartmann writes Eine Analyse nach den Lehren von Milton Friedman
Marc Chandler writes March 2025 Monthly
| With the Fed (sadly) taking center stage last week, and market rejections of its rate hikes at the forefront, lost in the drama was January 2022 TIC. Understandable, given all its misunderstood numbers are two months behind at their release. There were some interesting developments regardless, and a couple of longer run parts that deserve some attention.
Picking up where TIC left off from December, when more indicated bad (tight money) than good (not as tight), January kind of reversed the balance. Maybe. The TIC figures are some of the noisiest high frequency data you’ll ever see, so any interpretations are immediately highly salted. We had pointed out, for example, that US banks reported fewer of their own liabilities to foreigners in December; it had actually been a pretty steep decline. That was reversed in January not unlike a slightly more reflation-y stand across global markets when compared to the prior month. |
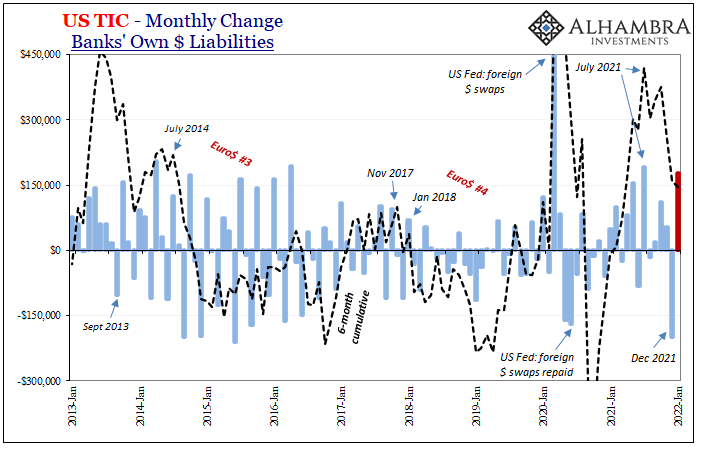 |
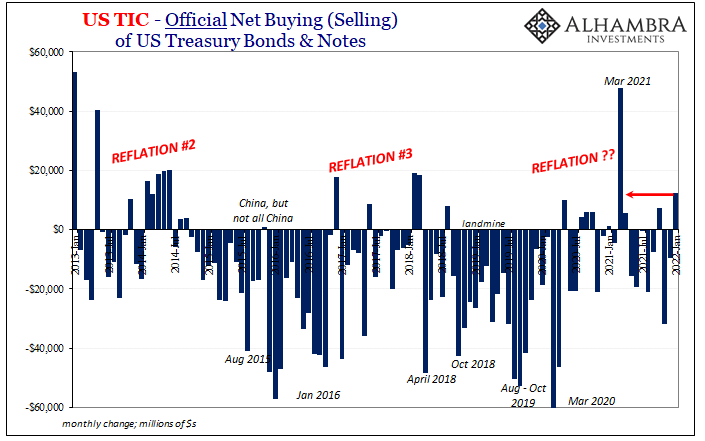
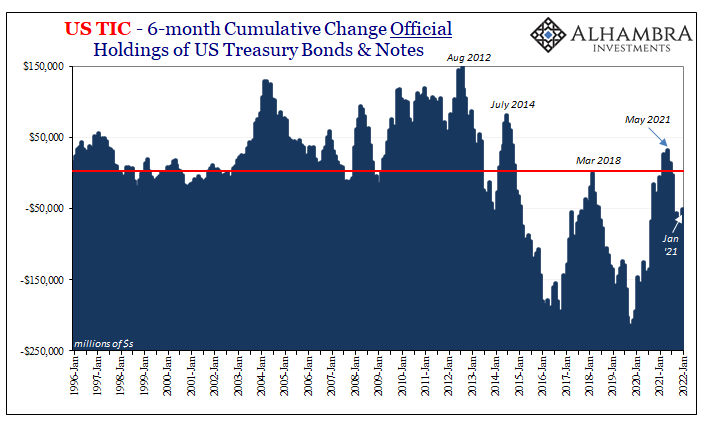
| The 6-month average actually fell slightly since January’s increase had replaced July’s which was a little bit larger. Same trend.Along with that rise in bank liabilities, foreign governments and central banks actually bought some US Treasury notes and bonds, on net, during the month (just when those Treasuries were selling off). It was actually the largest single-month bid for them since last March’s big top.
The 6-month cumulative, however, didn’t change a whole lot because, for now, the trend remains tipped toward official selling (dollar shortage, or why foreign central banks and governments always sell their UST’s when they are rising in value). |
 |
 |
|
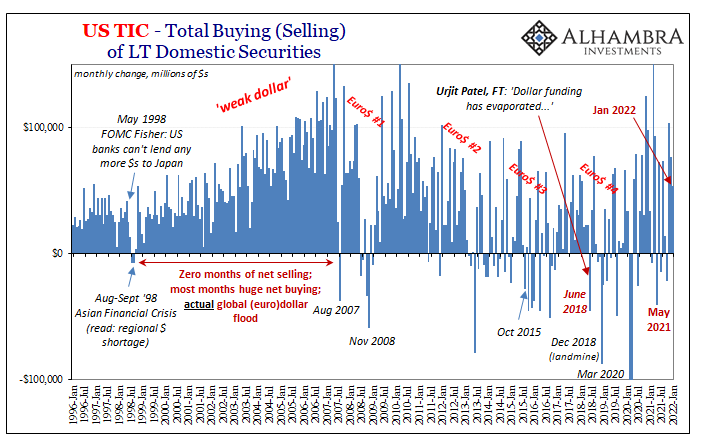
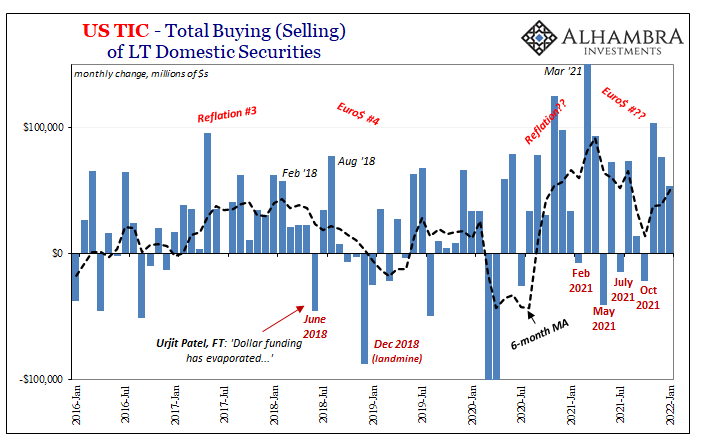
| The headline TIC figure, the net balance of all LT US$ assets bought (sold) by all foreigners (public and private), it actually decelerated from December. Private overseas investors bought a lot fewer US$ assets in January ($29.1 billion) than they had the month before ($77.5 billion).
Private holders had put up for more US$ assets up to November after a hefty and concerning across-the-board decline in October. This overall monthly number contrasts with the more favorable official UST activity, for now just contributing more noise. |
 |
 |
|
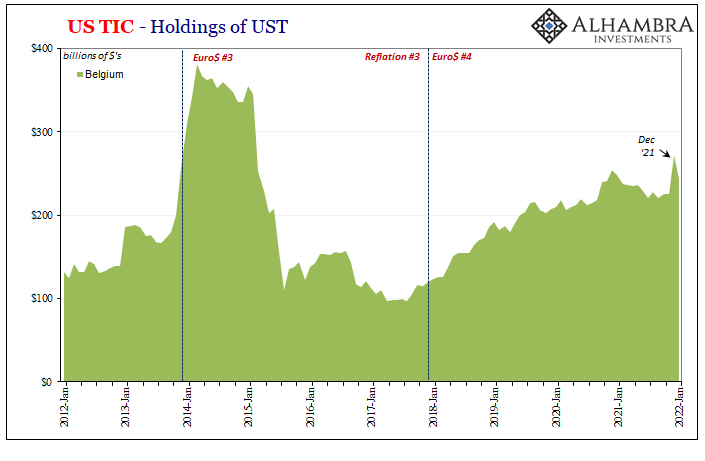
| Another datapoint we had highlighted from December was the reported balance of USTs being held in Belgium. For what might have been Russian reasons, the TIC figures showed a massive single-month jump of nearly $50 billion, reminiscent of early 2014 (the last time Ukraine and Russia were a top-level geopolitical risk).
According to the report for January 2022, a chunk of those USTs must’ve been in and out; $46.8 billion deposited during December, then $28.7 billion removed in January, destination(s) unknown. That still left a little less than $20 billion of the original deposit which I still believe might just be more Chinese than Russian. |
 |
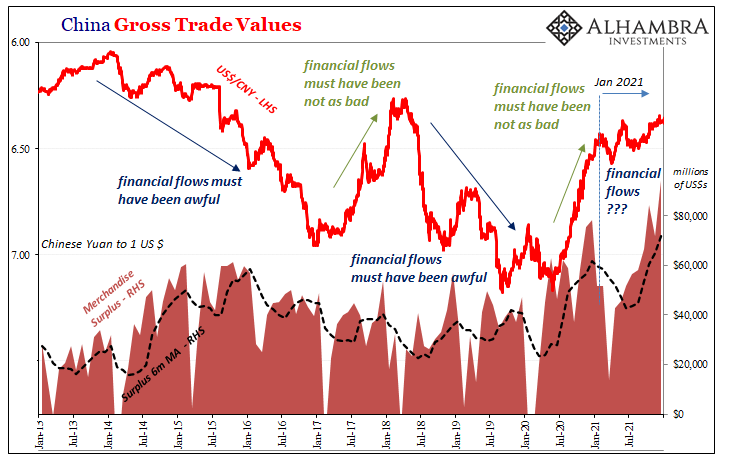
| As to the former, China, more USTs keep going out dating back to October This continues, obviously, the longer run dollars-are-very-hard-to-come-by trajectory though, as noted here, the Chinese have benefited from what may have been (still be) the largest merchandise trade surplus in human history (though there is historical evidence that China’s surplus with Europe in the late 14th and early 15th century could have been proportionally larger). | 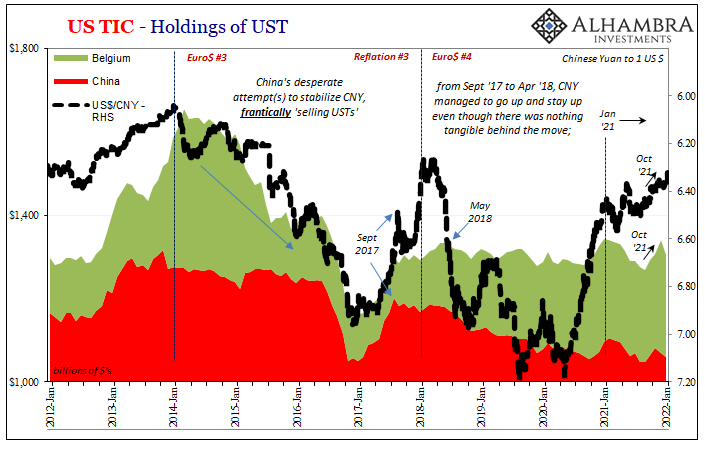 |
 |
|
| Though we have no idea what’s flowing into and out from Belgium, the more important, less-noisy data seems more in line with China experiencing financial eurodollar difficulties over and above the gross inflow due from goods.
In other words, nothing really changed here. What’s been perhaps the clearest pure signal is US bank claims on other banks in Japan and across the Caribbean. While not completely free from short run noise, going all the way back to November 2020 there’s been less eurodollar activity (remember that lack of growth is itself a contraction, so an outright negative is doubly so) indicated by what’s going, or what’s not, into Japan and toward Emil’s palatial beachfront lair. Both of those declined again pretty substantially during January. |
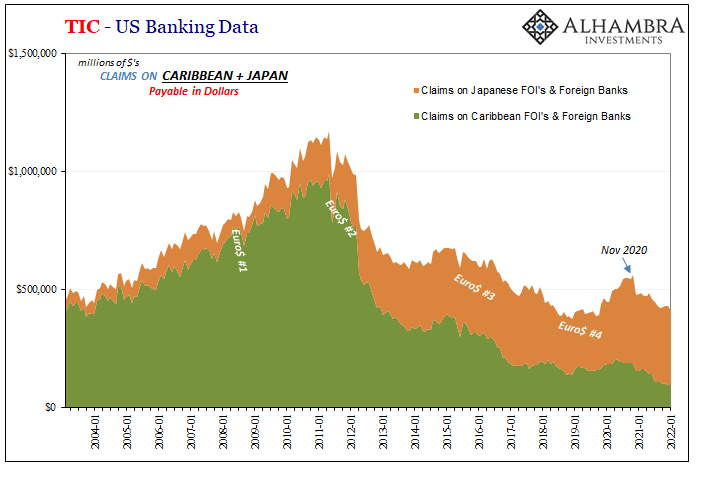 |
| Some of that was “rerouted” through Europe, a monthly positive, for whatever that might mean. Either way, you can see the geographical hole in global dollar (re)distribution as the ebbs and flows in each of these places more than cancels out those in others. | 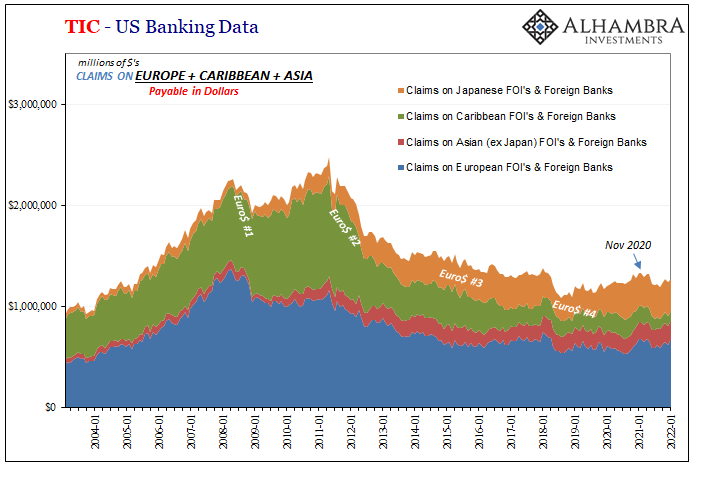 |
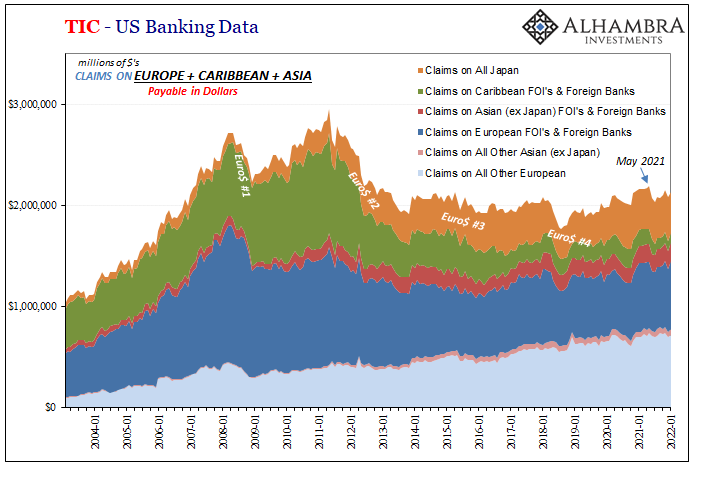
| When you put all the regions together include all the types of counterparties (those in the “other” category), excluding Caribbean non-banks due to the discontinuity of CLOs stored in Emil’s basement (more on this below), the decline in US bank lending to Tokyo and the Cayman Islands is more than any increase in lending toward European firms or those in Asia outside of Japan since May last year.
Thus, from a very broad perspective, more had been less or tight than not over the final half of 2021 and beginning 2022. |
 |
| One key reason why I’ve backed out those CLOs from the Caribbean totals is due to both breaks in the data along with unclear reasons why so many of these things have shown up ever since the middle of 2018.
Has the pre-crisis Eurobond securitization mechanism been that much restarted, or has the Treasury Department been that unable to track the deal-making until recently? There are no good answers, though this data (since mid-2018) does correspond to increased use across repo markets outside the US (and therefore potential for another collateral bottleneck). In TIC’s dense jargon, these CLOs are |
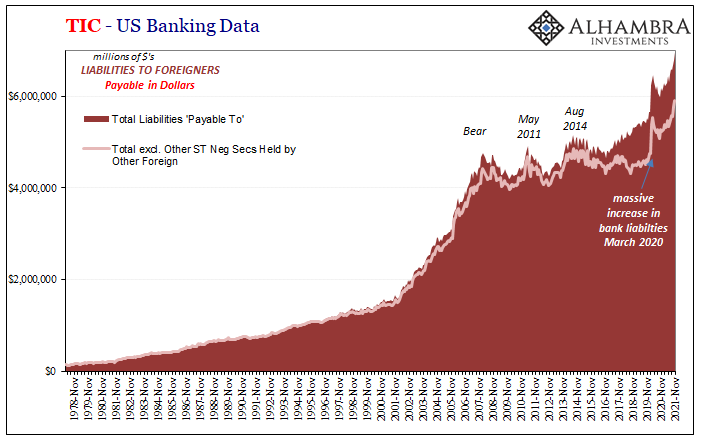 |
| Other Short-Term Negotiable Securities Held by Other Foreigners (where “other” foreigners refers to neither banks nor official institutions like central banks or governments). | 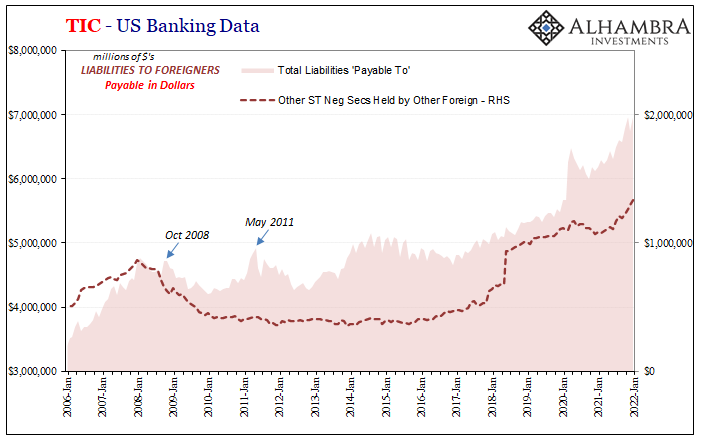 |
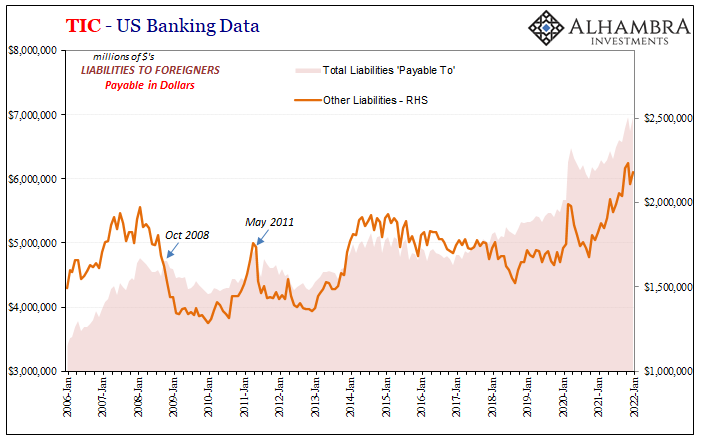
| And if you think this is already too many “others”, there’s yet another “other” which deserves some attention, too, especially for how it has, or maybe had, been raising the TIC red (US bank liabilities payable to foreigners in US$s) so much over the last year plus.
In addition to a flood of Eurobond CLO deals, apparently US banks have also reported a huge increase in liabilities due from their customers, not their own activities. It’s always hard to say for sure, but the TIC instructions indicate that most of this latter “other” is when US-domiciled bank customers go through US banks to borrow US$s from outside the country in one form or another (and US banks manage the liabilities). |
 |
| We would like to (or I would, anyway) assume that these bank customers are large corporate clients, but doing so in this case would actually raise far more questions than provide any answers.
Who else in the US must have been borrowing so much from outside? Thus, for reasons unknown, this particular “other” has been largely responsible for most of the total increase for TIC red (chart immediately below; the one following shows bank liabilities excluding both of these others): This is, as you can see, something new. What’s the deal, and who’s making them? No idea, but what may be important is the sizable drop in the deal-making being managed by US banks on behalf of whomever during December, which was only partly retraced in January. A possible inflection? We have to wonder if dollars became somewhat more difficult to borrow for whatever purposes since this was the same time when US$ curves really started to show strain. Or is this just more short run noise on top of the long run data noise? |
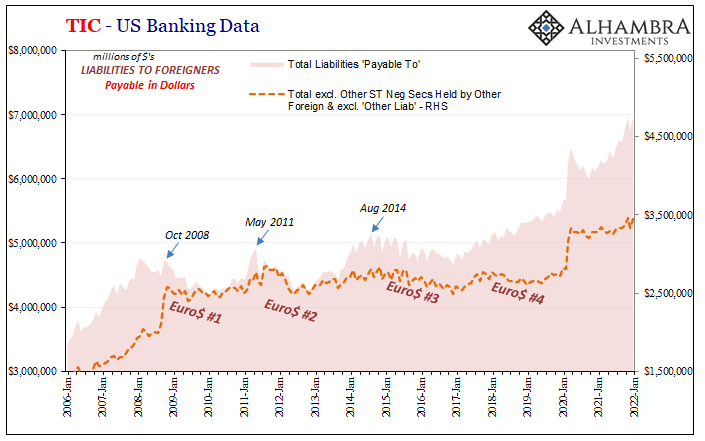 |
The more straightforward interpretations are where banks and geography are key. It just gets complicated when you ponder, or try to, what bank customers might have been up to, or why (and then how) CLO issuance continues to proliferate all over the rest of the world. Both might be emblematic of far-down-the-line risk-taking behavior.
But with some of the bank-related activity breaking down further, it might just be the effects ripple into all these other “others.”
TIC for February then March Madness (curves, not basketball) should be interesting.
Tags: $CNY,Belgium,Bonds,caribbean,Cayman Islands,China,currencies,economy,eurodollar system,Europe,Featured,Federal Reserve/Monetary Policy,global dollar shortage,Japan,Markets,newsletter,tic


