Three relatively quick observations surrounding today’s UST selloff. 1. The intensity. Reflation is the underlying short run basis, but there is ample reason to suspect quite a bit more than that alone given the unexpected interruption in Fedwire yesterday. At 12:43pm EST, most of FRBNY’s electronic services experienced an as-yet unexplained problem which interrupted service, including that of Fedwire. To this point, the New York branch has only confirmed the disruption – lasting several hours – took place, which has been blamed on an unspecified “operational error.” Reports indicate that settlement deadlines were extended into the evening, which can, and has in the past, led to short-term disturbances in interbank venues and conditions. Crypto exchanges, in
Topics:
Jeffrey P. Snider considers the following as important: 5.) Alhambra Investments, august 1990, blackout, bond rout, bonds, case counts, COVID, currencies, economy, Featured, Federal Reserve/Monetary Policy, fedwire, inflation, inflation breakevens, interbank liquidity, Markets, newsletter, TIPS, U.S. Treasuries, Yield Curve
This could be interesting, too:
Nachrichten Ticker - www.finanzen.ch writes Die Performance der Kryptowährungen in KW 9: Das hat sich bei Bitcoin, Ether & Co. getan
Nachrichten Ticker - www.finanzen.ch writes Wer verbirgt sich hinter der Ethereum-Technologie?
Martin Hartmann writes Eine Analyse nach den Lehren von Milton Friedman
Marc Chandler writes March 2025 Monthly
Three relatively quick observations surrounding today’s UST selloff.
1. The intensity. Reflation is the underlying short run basis, but there is ample reason to suspect quite a bit more than that alone given the unexpected interruption in Fedwire yesterday.
At 12:43pm EST, most of FRBNY’s electronic services experienced an as-yet unexplained problem which interrupted service, including that of Fedwire. To this point, the New York branch has only confirmed the disruption – lasting several hours – took place, which has been blamed on an unspecified “operational error.”
Reports indicate that settlement deadlines were extended into the evening, which can, and has in the past, led to short-term disturbances in interbank venues and conditions. Crypto exchanges, in addition to mocking the Fed, reported problems in their own clearing (since cleared up).
Since Fedwire reaches into all sorts of various plumbing parts of the system, right as we’ve been talking about these lately, this would include settlement therefore liquidity across several interbank spaces including US government securities.
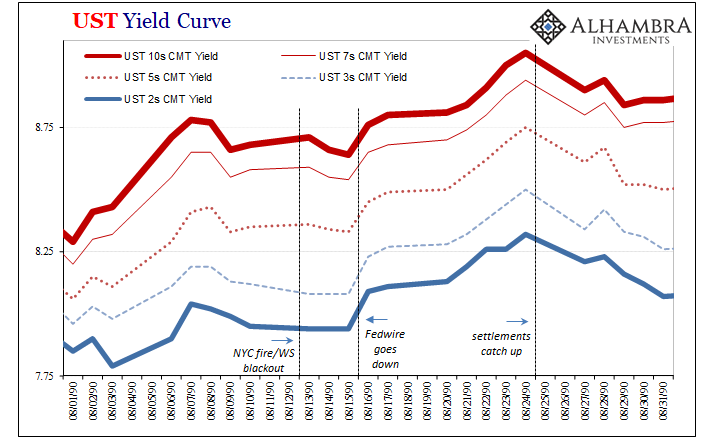
There is precedence; in mid-August 1990, Fedwire went down for a combination of unlikely factors. I write about these, and deeper context, in more detail for publication tomorrow. Here’s the synopsis (I’ll add the link tomorrow when it gets published):
It began with a four-alarm fire, a literal fire, raging in downtown NYC, gutting a key electrical substation that served Wall Street’s primary infrastructure.
The ensuing localized blackout on Monday August 13, emptied skyscrapers, including an evacuation of the Twin Towers, before forcing the American stock exchange to early close and, according to the New York Times, “The bond market and foreign-exchange trading slowed because broker intermediaries who supply prices for buyers and sellers were cut off, their squawk-box intercoms suddenly quiet, their computers no longer humming.”
At the Federal Reserve Bank of New York, the power outage had meant the immediate deployment of backup power. Then, out of the blue, a water-cooling pipe ruptures on Thursday August 16 which unbelievably takes down two out of the three emergency electrical generators still feeding FRBNY’s vast computerized operations.
| As you’ll see below, there was no effect on UST yields (nor money rates) when the local blackout struck even though it required the evacuation, and communication interruption, for a significant section of Wall Street and its traders.
But when Fedwire goes down three days later for the loss of backup generation (with main power not yet restored), that is what led to some chaos in money markets as well as frenzied serious selling across Treasuries; on August 16 alone, the 10-year yield jumped 12 bps; the 2-year, 15 bps. Unable to immediately catch up, backing up transactions across Fedwire, by August 24 there was an estimated $150 billion in those left to be matched, cleared, and settled. From August 16, when interruption began, to August 24, the 10-year yield surged a total of 41 bps; the 2-year, 38 bps. |
UST Yield Curve, 1990 |
| 2. The context. The bond selloff is being overhyped as if this is something unusual. Despite US Treasuries being considered “safe assets” this generally has little to do with price or lack of price volatility. The truth is UST prices have been, at times, extremely volatile (meaning “safety” is more about liquidity and credit characteristics).
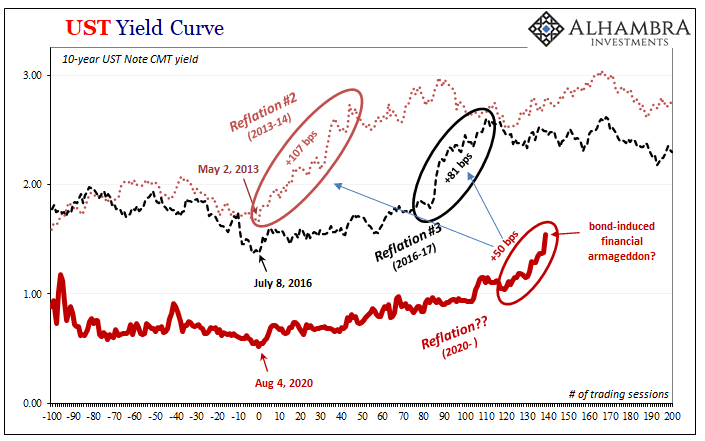
This is why we’ve been comparing the current trend to prior reflationary periods; as you can see, what’s been happening over the past few weeks and months is right in line (at most) with those previous periods. To this point, the sell off has yet to even equal any of them, including those not pictured (2010, 2011). |
UST Yield Curve, 2020 |
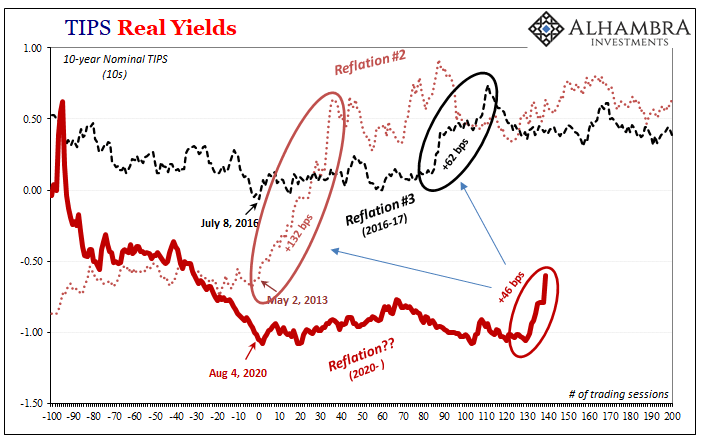
| Each and every time yields back up as they have, it is declared to be the start of The Big One. To date, though the “rout” in bonds during those prior trends had lasted longer and went farther, including real yields, none of them ended up being anything other than false dawns or head-fakes.
In other words, there isn’t anything yet that is unusual about the current Treasury sell-off – with the exception of the Fedwire incident on Wednesday contributing something to the acceleration (and more uncertainty about how long this may go on; details remain sketchy, itself an indication that it may have been more serious than officials would want the public to know about). |
TIPS Real Yields |
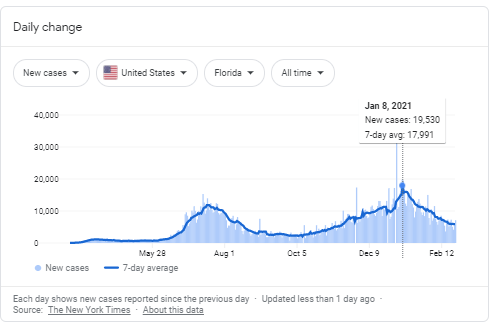
| 3. The reason. The growing reflationary vibe across the yield curve (apart from bills) is almost certainly due to the COVID “curve”:
You can match up the decline in case counts and other pandemic metrics to the rise in longer-end yields. The Treasury market is beginning to price scenarios – assuming no hitch in vaccinations nor re-acceleration in contagiousness – where the economy becomes largely COVID-free (assuming also governments accede to the data) at some point in the near rather than distant future. Furthermore, it is being assumed there’s a decent chance Uncle Sam’s helicopter payments will be able to clean up or at least paper over any leftover damage from the deep and longer-lasting recession (when compared to initial “V”-shaped expectations). |
Daily Change, 2020-2021 |
| Pandemic-free with the feds absorbing the majority losses is the Goldilocks scenario; and, despite the sell-off, it isn’t being priced as some sure thing. It’s only being interpreted this way.
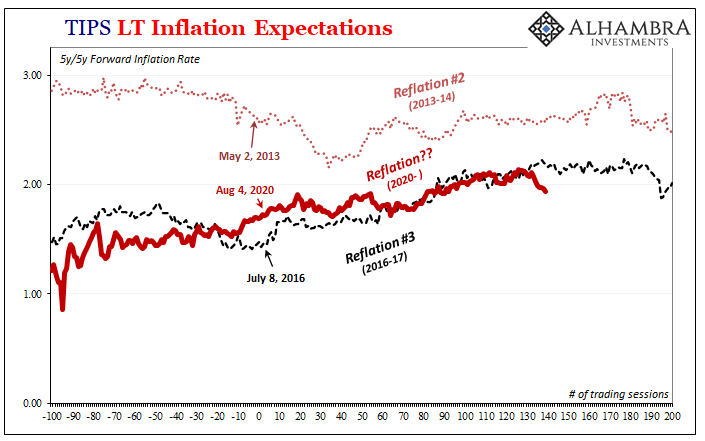
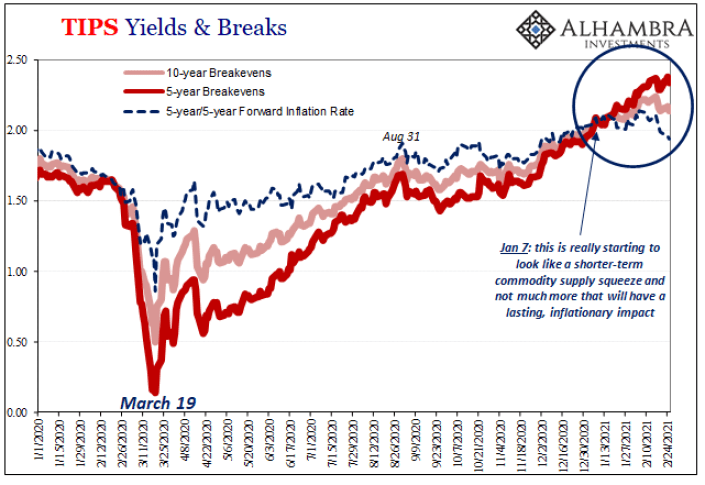
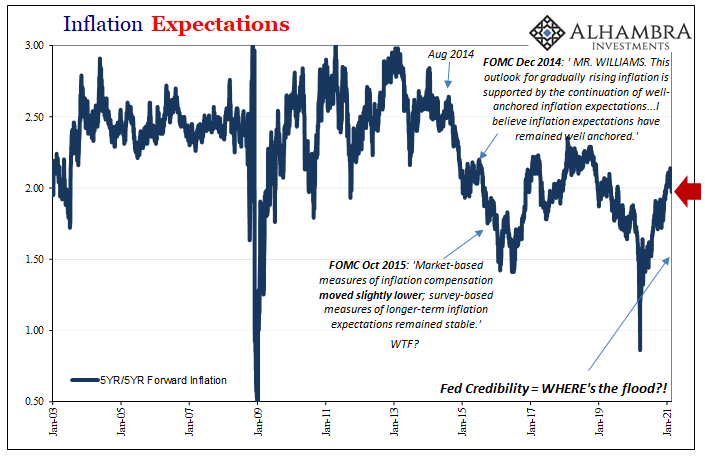
In other words, just like each of the prior four (five, depending upon how you classify 2010) reflationary periods, bond yields are rising, the yield curve is steepening, and real rates are moving based on a probability spectrum that increasingly sees the intermediate term as less bad than the recent past. This isn’t the same thing as some surefire inflationary recovery, as we can also increasingly observe via inflation expectations. |
TIPS LT Inflation Expectations, 2016-2020 |
TIPS Yields & Breaks, 2020-2021 |
|
Inflation Expectations, 2003-2021 |
Tags: august 1990,blackout,bond rout,Bonds,case counts,COVID,currencies,economy,Featured,Federal Reserve/Monetary Policy,fedwire,inflation,inflation breakevens,interbank liquidity,Markets,newsletter,TIPS,U.S. Treasuries,Yield Curve

